50 Washington Ave Cincinnati, OH 45246
Estimated Value: $290,000 - $348,873
About This Home
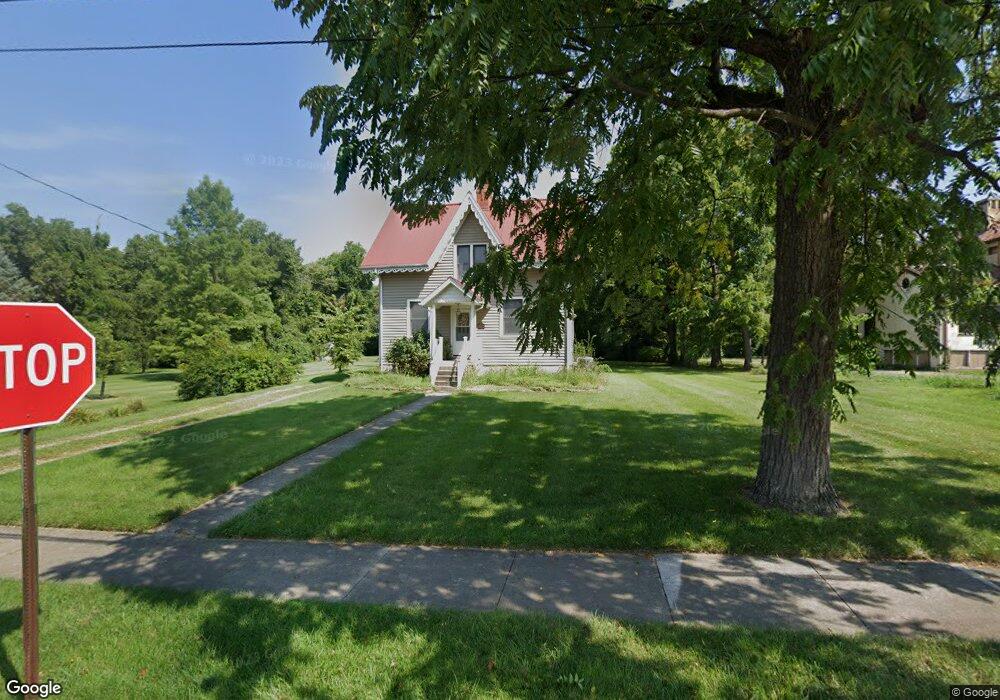
This home is located at 50 Washington Ave, Cincinnati, OH 45246 and is currently estimated at $326,968, approximately $183 per square foot. 50 Washington Ave is a home located in Hamilton County with nearby schools including Glendale Elementary School, Princeton Community Middle School, and Princeton High School.
Ownership History
We collect this data history from publicly available records. To have your information removed, we recommend requesting removal directly through your county’s website.
Purchase Details
Home Financials for this Owner
Home Financials are based on the most recent Mortgage that was taken out on this home.Purchase Details
Home Financials for this Owner
Home Financials are based on the most recent Mortgage that was taken out on this home.Purchase Details
Home Financials for this Owner
Home Financials are based on the most recent Mortgage that was taken out on this home.Home Values in the Area
Average Home Value in this Area
Purchase History
We collect this data history from publicly available records. To have your information removed, we recommend requesting removal directly through your county’s website.
| Date | Buyer | Sale Price | Title Company |
|---|---|---|---|
| $165,000 | Cambridge Land Title Agency | ||
| $170,000 | -- | ||
| $125,000 | Midland Title Security Inc |
Mortgage History
We collect this data history from publicly available records. To have your information removed, we recommend requesting removal directly through your county’s website.
| Date | Status | Borrower | Loan Amount |
|---|---|---|---|
| Open | $153,000 | ||
| Previous Owner | $160,500 | ||
| Previous Owner | $118,750 |
Tax History
We collect this data history from publicly available records. To have your information removed, we recommend requesting removal directly through your county’s website.
| Year | Tax Paid | Tax Assessment Tax Assessment Total Assessment is a certain percentage of the fair market value that is determined by local assessors to be the total taxable value of land and additions on the property. | Land | Improvement |
|---|---|---|---|---|
| 2025 | $4,489 | $65,100 | $29,372 | $35,728 |
| 2023 | $3,733 | $65,100 | $29,372 | $35,728 |
| 2022 | $3,518 | $49,970 | $11,834 | $38,136 |
| 2021 | $3,301 | $49,970 | $11,834 | $38,136 |
| 2020 | $3,355 | $49,970 | $11,834 | $38,136 |
| 2019 | $3,268 | $45,017 | $10,661 | $34,356 |
| 2018 | $3,117 | $45,017 | $10,661 | $34,356 |
| 2017 | $2,958 | $45,017 | $10,661 | $34,356 |
| 2016 | $2,924 | $44,437 | $10,735 | $33,702 |
| 2015 | $2,955 | $44,437 | $10,735 | $33,702 |
| 2014 | $2,962 | $44,437 | $10,735 | $33,702 |
| 2013 | $2,845 | $43,145 | $10,423 | $32,722 |
Map
- 1120 Jefferson Ave
- 45 S Lake Ave
- 163 Washington Ave
- 103 W Sharon Rd
- 820 van Nes Dr
- 835 Ivy Ave
- 217 Droxford Ct
- 117 Harter Ave
- 207 Diston Ln
- 9 Little Creek Ln
- 19 Creekwood Square
- 444 W Sharon Rd
- 11615 Maxey Ln
- 468 Dorothy Ln
- 11570 Rose Ln
- 162 Sheffield Rd
- 531 W Kemper Rd
- 10643 Morning Glory Ln
- 10937 Chester Rd
- 505 Glendale Milford Rd
- 42 Washington Ave
- 44 Washington Ave
- 36 Washington Ave
- 1125 Church Ave
- 64 Washington Ave
- 1115 Church Ave
- 60 Washington Ave
- 59 Washington Ave
- 68 Washington Ave
- 28 Washington Ave
- 63 Washington Ave
- 32 Washington Ave
- 33 Washington Ave
- 1105 Church Ave
- 22 Washington Ave
- 67 Washington Ave
- 72 Washington Ave
- 27 Washington Ave
- 71 Washington Ave
- 1085 Church Ave
Ask me questions while you tour the home.