
Seller's Agent in 2025
Neil Williams
@properties Christie's International Real Estate
(847) 800-6570
4 in this area
111 Total Sales
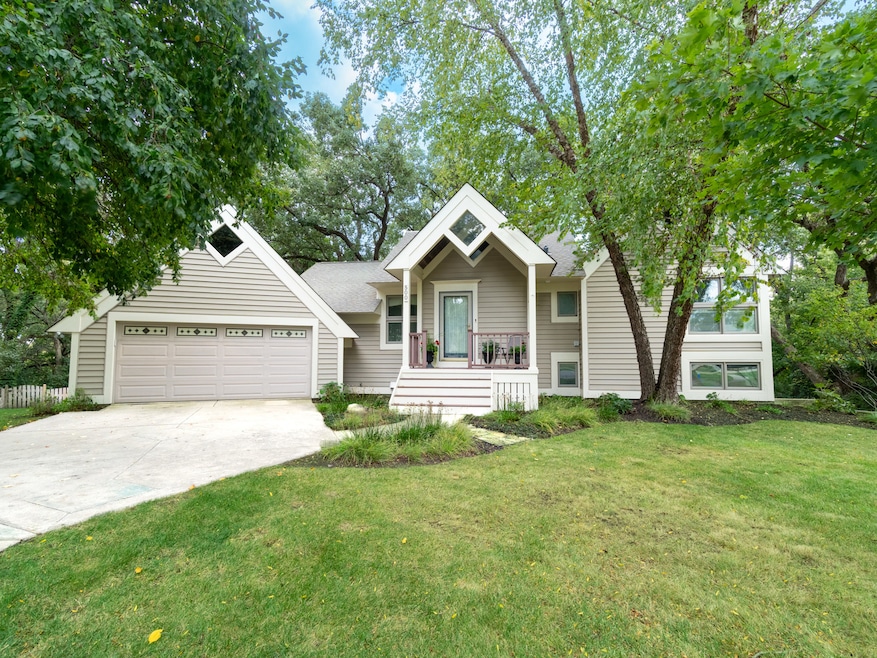


This architect-designed split-level home features 4 bedrooms and 3 full bathrooms, set on a private lot that backs up to a lush nature preserve. Expansive windows throughout the home provide abundant natural light and serene views. The open-concept kitchen includes 40-inch cherry cabinets, granite countertops, a tile backsplash, an island, eat-in area, and breakfast bar, offering both ample storage and excellent space for entertaining. The kitchen opens to a deck, creating seamless indoor-outdoor living. The great room boasts soaring ceilings and skylights, creating a bright and welcoming atmosphere. The large primary suite includes a huge walk-in closet and an updated en suite bathroom. Two additional bedrooms share a full bath, and a private guest suite includes its own bathroom and deck access. The lower level features dual sliding glass doors that lead to an oversized backyard deck overlooking the wooded preserve, perfect for entertaining or relaxing. Located just minutes from the Metra, Fox River, and outdoor recreation. This home is also in a highly rated school district and offers a rare blend of privacy, space, and architectural charm.
Last Agent to Sell the Property
@properties Christie's International Real Estate License #475157966 Listed on: 10/02/2025
| Date | Type | Sale Price | Title Company |
|---|---|---|---|
| Deed | $485,000 | None Listed On Document | |
| Interfamily Deed Transfer | -- | Attorney |
| Date | Status | Loan Amount | Loan Type |
|---|---|---|---|
| Open | $363,750 | New Conventional |
| Date | Event | Price | List to Sale | Price per Sq Ft |
|---|---|---|---|---|
| 11/07/2025 11/07/25 | Sold | $485,000 | -1.0% | $160 / Sq Ft |
| 10/04/2025 10/04/25 | Pending | -- | -- | -- |
| 10/02/2025 10/02/25 | For Sale | $490,000 | -- | $162 / Sq Ft |
| Year | Tax Paid | Tax Assessment Tax Assessment Total Assessment is a certain percentage of the fair market value that is determined by local assessors to be the total taxable value of land and additions on the property. | Land | Improvement |
|---|---|---|---|---|
| 2024 | $11,347 | $132,940 | $27,899 | $105,041 |
| 2023 | $10,850 | $118,898 | $24,952 | $93,946 |
| 2022 | $12,469 | $130,675 | $25,876 | $104,799 |
| 2021 | $12,142 | $121,740 | $24,107 | $97,633 |
| 2020 | $11,853 | $117,431 | $23,254 | $94,177 |
| 2019 | $11,456 | $112,396 | $22,257 | $90,139 |
| 2018 | $11,276 | $103,830 | $20,561 | $83,269 |
| 2017 | $11,085 | $97,815 | $19,370 | $78,445 |
| 2016 | $10,925 | $91,741 | $18,167 | $73,574 |
| 2013 | -- | $73,170 | $16,947 | $56,223 |
Seller's Agent in 2025
Neil Williams
@properties Christie's International Real Estate
(847) 800-6570
4 in this area
111 Total Sales
Buyer's Agent in 2025
Kim Alden
Compass
(847) 254-5757
6 in this area
1,547 Total Sales
Source: Midwest Real Estate Data (MRED)
MLS Number: 12477912
APN: 20-19-278-035
Disclaimer: Certain information contained herein is derived from information provided by parties other than Homes.com. All information provided is deemed reliable, but is not guaranteed to be accurate and should be independently verified.
![]() Based on information submitted to the MLS GRID. All data is obtained from various sources and may not have been verified by broker or MLS GRID. Supplied Open House Information is subject to change without notice. All information should be independently reviewed and verified for accuracy. Properties may or may not be listed by the office/agent presenting the information. Some IDX listings have been excluded from this website.
Based on information submitted to the MLS GRID. All data is obtained from various sources and may not have been verified by broker or MLS GRID. Supplied Open House Information is subject to change without notice. All information should be independently reviewed and verified for accuracy. Properties may or may not be listed by the office/agent presenting the information. Some IDX listings have been excluded from this website.
Listings courtesy of Midwest Real Estate Data (MRED) as distributed by MLS GRID
Ask me questions while you tour the home.