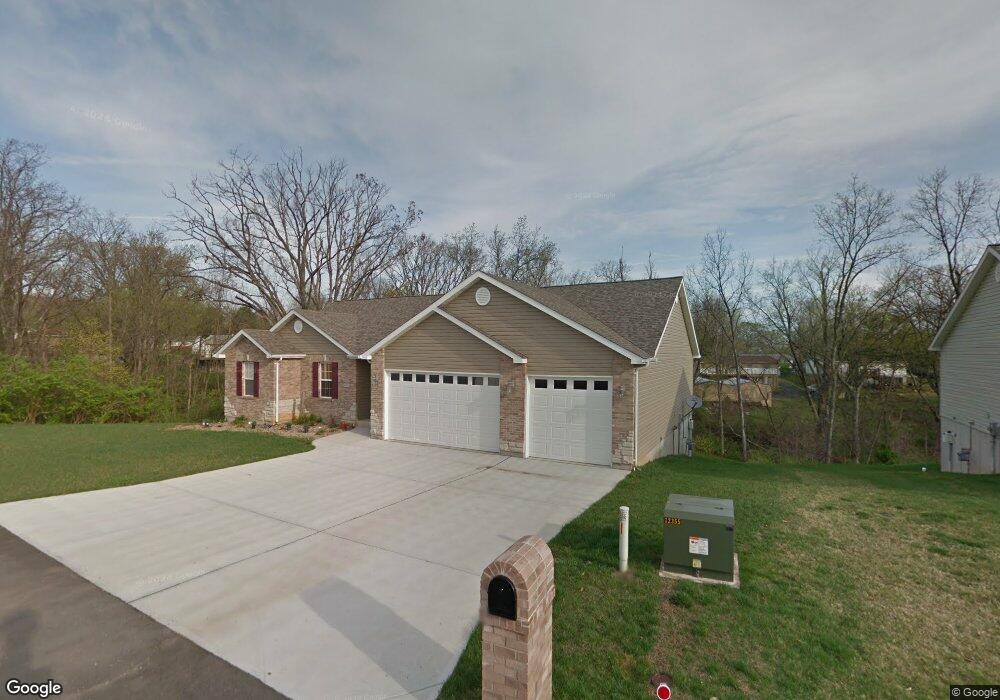
5001 Coffman Ln Imperial, MO 63052
Estimated Value: $320,000 - $492,000
3
Beds
2
Baths
1,800
Sq Ft
$208/Sq Ft
Est. Value
About This Home
This home is located at 5001 Coffman Ln, Imperial, MO 63052 and is currently estimated at $375,218, approximately $208 per square foot. 5001 Coffman Ln is a home located in Jefferson County with nearby schools including Raymond & Nancy Hodge Elementary School, Seckman Middle School, and Seckman Senior High School.
Ownership History
Date
Name
Owned For
Owner Type
Purchase Details
Closed on
Apr 26, 2011
Sold by
Boyster James
Bought by
Ford Alan M and Ford Mavis L
Current Estimated Value
Home Financials for this Owner
Home Financials are based on the most recent Mortgage that was taken out on this home.
Original Mortgage
$243,651
Outstanding Balance
$166,431
Interest Rate
4.82%
Mortgage Type
New Conventional
Estimated Equity
$208,787
Purchase Details
Closed on
Dec 2, 2010
Sold by
Maxwell Nicholas and Maxwell Laura
Bought by
Boyster James
Purchase Details
Closed on
Oct 30, 2009
Sold by
Lepp Deanna and Lepp William H
Bought by
Maxwell Nicholas and Maxwell Laura
Home Financials for this Owner
Home Financials are based on the most recent Mortgage that was taken out on this home.
Original Mortgage
$15,000
Interest Rate
5.03%
Mortgage Type
New Conventional
Purchase Details
Closed on
Nov 11, 2008
Sold by
Boyster James
Bought by
Boyster Deanna
Create a Home Valuation Report for This Property
The Home Valuation Report is an in-depth analysis detailing your home's value as well as a comparison with similar homes in the area
Home Values in the Area
Average Home Value in this Area
Purchase History
| Date | Buyer | Sale Price | Title Company |
|---|---|---|---|
| Ford Alan M | -- | Htc | |
| Boyster James | -- | None Available | |
| Maxwell Nicholas | -- | Insured Title Agency | |
| Boyster Deanna | -- | None Available |
Source: Public Records
Mortgage History
| Date | Status | Borrower | Loan Amount |
|---|---|---|---|
| Open | Ford Alan M | $243,651 | |
| Previous Owner | Maxwell Nicholas | $15,000 |
Source: Public Records
Tax History
| Year | Tax Paid | Tax Assessment Tax Assessment Total Assessment is a certain percentage of the fair market value that is determined by local assessors to be the total taxable value of land and additions on the property. | Land | Improvement |
|---|---|---|---|---|
| 2025 | $2,912 | $44,600 | $4,800 | $39,800 |
| 2024 | $2,912 | $40,800 | $4,800 | $36,000 |
| 2023 | $2,912 | $40,800 | $4,800 | $36,000 |
| 2022 | $2,856 | $40,300 | $4,800 | $35,500 |
| 2021 | $2,858 | $40,300 | $4,800 | $35,500 |
| 2020 | $2,702 | $36,100 | $4,200 | $31,900 |
| 2019 | $2,710 | $36,100 | $4,200 | $31,900 |
| 2018 | $2,690 | $36,100 | $4,200 | $31,900 |
| 2017 | $2,605 | $36,100 | $4,200 | $31,900 |
| 2016 | $2,236 | $33,400 | $4,000 | $29,400 |
| 2015 | $2,242 | $33,400 | $4,000 | $29,400 |
| 2013 | -- | $32,800 | $4,000 | $28,800 |
Source: Public Records
Map
Nearby Homes
- 2721 Cindy Dr
- 68 Rex Aire Ct Unit 68
- 80 Rex Aire Ct
- 101 Rex Aire Ct Unit 101
- 3232 Quervo Ln
- 3001 Northern Lights Dr
- 3224 Quervo Ln
- 27 Rex Aire Ct Unit 27
- 3220 Quervo Ln
- 3233 Quervo Ln
- 2901 Jack Lynn Dr
- 3 Aspen II at Bella Terra
- 4829 Valley Meadows Ct
- 5144 Copperleaf Dr
- 2361 Prairie Hollow Rd
- 3 Aspen at Bella Terra
- 4518 Bella Terra Dr
- 4609 Bella Terra Dr
- 4514 Bella Terra Dr
- 3 Sterling at Bella Terra
- 5000 Coffman Ln
- 5030 Countryside Dr
- 0Lot 2 Coffman Ln
- 5026 Countryside Dr
- 5005 Coffman Ln
- 5022 Countryside Dr
- 5004 Coffman Ln
- 2671 Spring Forest Rd
- 5038 Countryside Dr
- 5018 Countryside Dr
- 5025 Countryside Dr
- 5033 Countryside Dr
- 2661 Spring Forest Rd
- 5042 Countryside Dr
- 5021 Countryside Dr
- 5037 Countryside Dr
- 5029 Countryside Dr
- 5014 Countryside Dr
- 2657 Spring Forest Rd
- 5046 Countryside Dr
Your Personal Tour Guide
Ask me questions while you tour the home.