Estimated Value: $443,000 - $510,000
5
Beds
3
Baths
2,676
Sq Ft
$176/Sq Ft
Est. Value
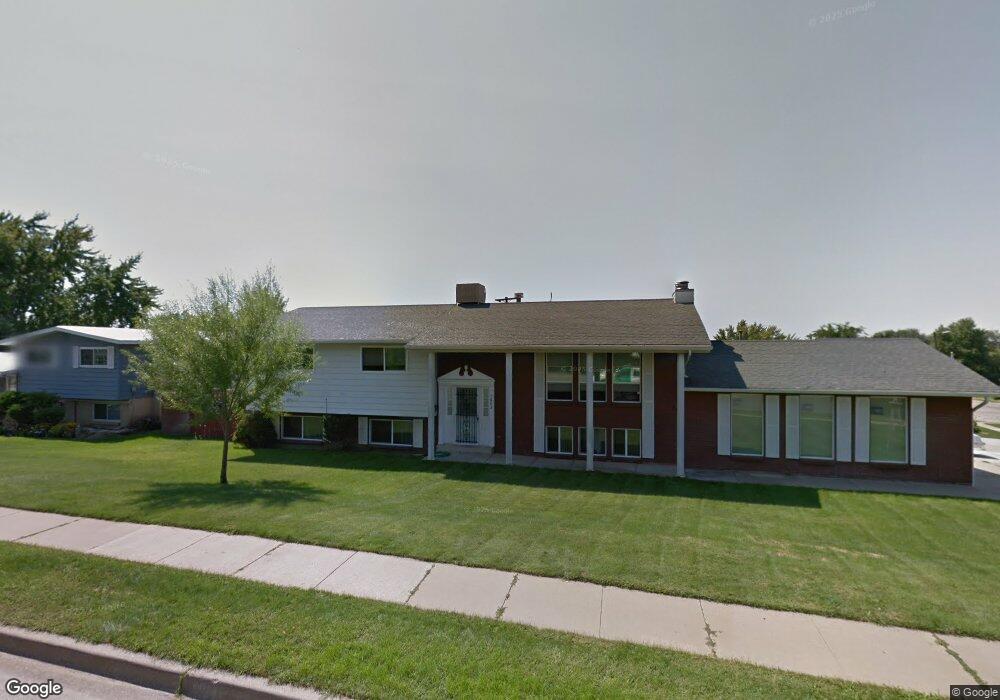
About This Home
This home is located at 5003 S 2575 W, Roy, UT 84067 and is currently estimated at $472,014, approximately $176 per square foot. 5003 S 2575 W is a home located in Weber County with nearby schools including Lakeview Elementary School, Roy Junior High School, and Roy High School.
Ownership History
Date
Name
Owned For
Owner Type
Purchase Details
Closed on
Mar 31, 2020
Sold by
Thompson Troy S
Bought by
Thompson Troy and Thompson Dora Margarita
Current Estimated Value
Purchase Details
Closed on
Feb 18, 2019
Sold by
Noble Jennifer L
Bought by
Thompson Troy S
Home Financials for this Owner
Home Financials are based on the most recent Mortgage that was taken out on this home.
Original Mortgage
$289,280
Outstanding Balance
$254,329
Interest Rate
4.5%
Mortgage Type
VA
Estimated Equity
$217,685
Purchase Details
Closed on
Sep 25, 2007
Sold by
Anderson Dennis
Bought by
Anderson Dennis and Anderson Charlotte J
Create a Home Valuation Report for This Property
The Home Valuation Report is an in-depth analysis detailing your home's value as well as a comparison with similar homes in the area
Home Values in the Area
Average Home Value in this Area
Purchase History
| Date | Buyer | Sale Price | Title Company |
|---|---|---|---|
| Thompson Troy | -- | None Available | |
| Thompson Troy S | -- | North Amer Ttl Ut Bountiful | |
| Anderson Dennis | -- | Backman | |
| Anderson Dennis | -- | Backman |
Source: Public Records
Mortgage History
| Date | Status | Borrower | Loan Amount |
|---|---|---|---|
| Open | Thompson Troy S | $289,280 |
Source: Public Records
Tax History
| Year | Tax Paid | Tax Assessment Tax Assessment Total Assessment is a certain percentage of the fair market value that is determined by local assessors to be the total taxable value of land and additions on the property. | Land | Improvement |
|---|---|---|---|---|
| 2025 | $2,828 | $452,099 | $120,000 | $332,099 |
| 2024 | $2,758 | $244,199 | $66,000 | $178,199 |
| 2023 | $2,509 | $221,100 | $63,153 | $157,947 |
| 2022 | $2,694 | $245,850 | $55,002 | $190,848 |
| 2021 | $2,131 | $318,000 | $69,994 | $248,006 |
| 2020 | $1,934 | $264,000 | $69,994 | $194,006 |
| 2019 | $1,967 | $254,000 | $41,690 | $212,310 |
| 2018 | $1,847 | $224,000 | $37,626 | $186,374 |
| 2017 | $1,871 | $214,000 | $37,626 | $176,374 |
| 2016 | $1,678 | $102,306 | $18,970 | $83,336 |
| 2015 | $1,553 | $96,798 | $16,160 | $80,638 |
| 2014 | $1,567 | $96,798 | $16,160 | $80,638 |
Source: Public Records
Map
Nearby Homes
- 2466 W 5075 S
- 5125 S 2600 W
- 2402 W 5075 S
- 4881 S 2400 W
- 5249 S 2500 W
- 5063 S 2825 W
- 5301 S 2675 W
- 2872 W 5000 S
- 4891 S 2875 W
- 283 3800 S 1900 W #283 Unit 283
- 5273 S 2800 W Unit 2A
- 5243 S 2200 W
- 5261 S 2200 W
- 2602 W 4600 S
- 5289 S 2200 W
- 5185 S 2100 W
- 4793 S 3025 W
- 5376 S 2200 W
- 5427 S 2200 W
- 2627 W 5625 S
Your Personal Tour Guide
Ask me questions while you tour the home.