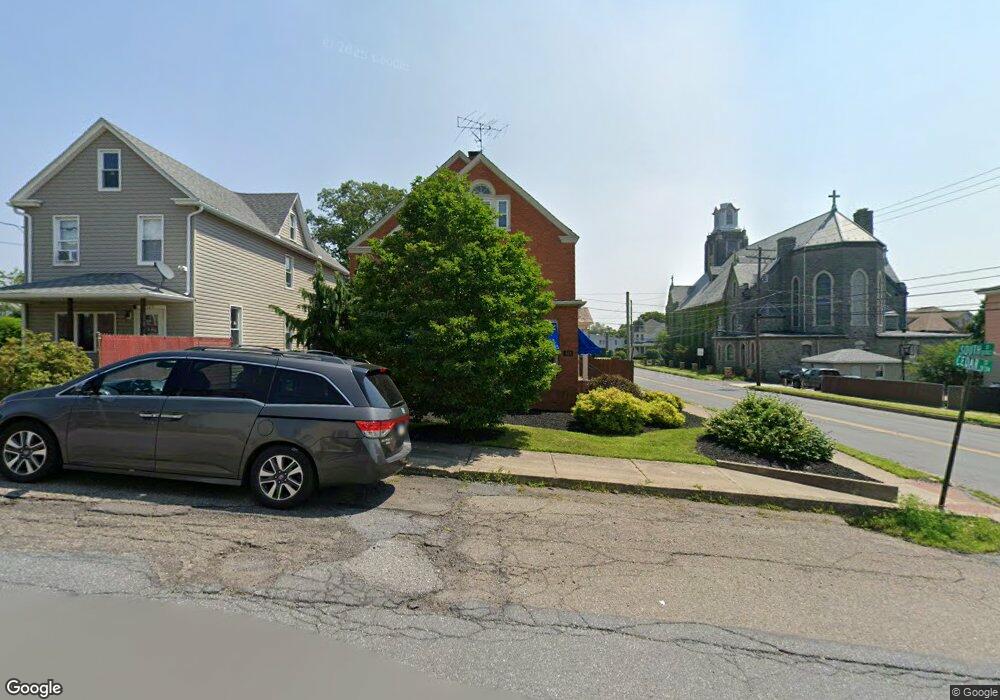
501 Cedar St Freeland, PA 18224
Estimated Value: $200,000 - $278,000
4
Beds
3
Baths
3,002
Sq Ft
$81/Sq Ft
Est. Value
About This Home
This home is located at 501 Cedar St, Freeland, PA 18224 and is currently estimated at $243,907, approximately $81 per square foot. 501 Cedar St is a home located in Luzerne County with nearby schools including Hazleton Area High School and Mmi Preparatory School.
Ownership History
Date
Name
Owned For
Owner Type
Purchase Details
Closed on
Apr 22, 2020
Sold by
Deltos Nicholas L and Deltos Del Tos
Bought by
Perez Javier L
Current Estimated Value
Home Financials for this Owner
Home Financials are based on the most recent Mortgage that was taken out on this home.
Original Mortgage
$176,739
Outstanding Balance
$160,816
Interest Rate
5.5%
Mortgage Type
FHA
Estimated Equity
$83,091
Purchase Details
Closed on
May 2, 1978
Bought by
Deitos Nicholas and Deitos Patricia A
Create a Home Valuation Report for This Property
The Home Valuation Report is an in-depth analysis detailing your home's value as well as a comparison with similar homes in the area
Home Values in the Area
Average Home Value in this Area
Purchase History
| Date | Buyer | Sale Price | Title Company |
|---|---|---|---|
| Perez Javier L | $180,000 | Fox Ridge Abstract | |
| Deitos Nicholas | $50,000 | -- |
Source: Public Records
Mortgage History
| Date | Status | Borrower | Loan Amount |
|---|---|---|---|
| Open | Perez Javier L | $176,739 |
Source: Public Records
Tax History
| Year | Tax Paid | Tax Assessment Tax Assessment Total Assessment is a certain percentage of the fair market value that is determined by local assessors to be the total taxable value of land and additions on the property. | Land | Improvement |
|---|---|---|---|---|
| 2026 | $3,592 | $139,200 | $20,100 | $119,100 |
| 2025 | $3,461 | $139,200 | $20,100 | $119,100 |
| 2024 | $3,345 | $139,200 | $20,100 | $119,100 |
| 2023 | $3,292 | $139,200 | $20,100 | $119,100 |
| 2022 | $3,257 | $139,200 | $20,100 | $119,100 |
| 2021 | $3,176 | $139,200 | $20,100 | $119,100 |
| 2020 | $2,991 | $139,200 | $20,100 | $119,100 |
| 2019 | $2,886 | $139,200 | $20,100 | $119,100 |
| 2018 | $2,795 | $139,200 | $20,100 | $119,100 |
| 2017 | $2,745 | $139,200 | $20,100 | $119,100 |
| 2016 | -- | $139,200 | $20,100 | $119,100 |
| 2015 | $1,816 | $139,200 | $20,100 | $119,100 |
| 2014 | $1,816 | $139,200 | $20,100 | $119,100 |
Source: Public Records
Map
Nearby Homes
- 1111 Lewis St
- Lot 001 Walnut St
- 305 Ridge St
- 416 Washington St
- 957 Chestnut St
- 343 Adams St
- 924 Pine St
- 909 Birkbeck St
- 2263 State Route 940 St
- 437 Alvin St
- 60 Woodside Dr
- 19 Upper Lehigh Main St
- 17 Upper Lehigh Main St
- 227 Avalanche Ln
- 237 Avalanche Ln
- 212 Bear Run Dr
- 251 Bear Run Dr
- 301 Shingle Mill Dr
- 332 Shingle Mill Dr
- 021 Shingle Mill Dr
Your Personal Tour Guide
Ask me questions while you tour the home.