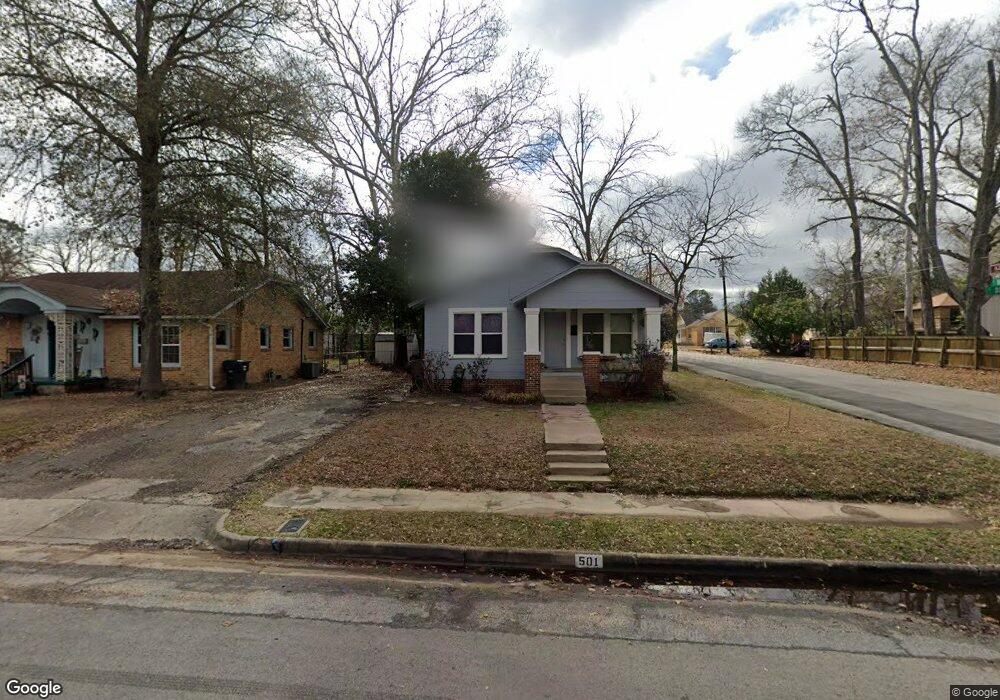
501 E Dodge St Tyler, TX 75701
Azalea District NeighborhoodEstimated Value: $146,000 - $186,000
Studio
1
Bath
1,106
Sq Ft
$151/Sq Ft
Est. Value
About This Home
This home is located at 501 E Dodge St, Tyler, TX 75701 and is currently estimated at $167,156, approximately $151 per square foot. 501 E Dodge St is a home located in Smith County with nearby schools including Bell Elementary School, Hubbard Middle School, and Tyler Legacy High School.
Ownership History
Date
Name
Owned For
Owner Type
Purchase Details
Closed on
Oct 7, 2022
Sold by
Harris Steven
Bought by
Osprey Equity Llc
Current Estimated Value
Home Financials for this Owner
Home Financials are based on the most recent Mortgage that was taken out on this home.
Original Mortgage
$135,250
Outstanding Balance
$122,825
Interest Rate
5.55%
Mortgage Type
New Conventional
Estimated Equity
$44,331
Create a Home Valuation Report for This Property
The Home Valuation Report is an in-depth analysis detailing your home's value as well as a comparison with similar homes in the area
Home Values in the Area
Average Home Value in this Area
Purchase History
| Date | Buyer | Sale Price | Title Company |
|---|---|---|---|
| Osprey Equity Llc | -- | -- |
Source: Public Records
Mortgage History
| Date | Status | Borrower | Loan Amount |
|---|---|---|---|
| Open | Osprey Equity Llc | $135,250 |
Source: Public Records
Tax History
| Year | Tax Paid | Tax Assessment Tax Assessment Total Assessment is a certain percentage of the fair market value that is determined by local assessors to be the total taxable value of land and additions on the property. | Land | Improvement |
|---|---|---|---|---|
| 2025 | $2,860 | $169,359 | $23,127 | $146,232 |
| 2024 | $2,383 | $140,103 | $29,768 | $110,335 |
| 2023 | $2,123 | $121,770 | $29,768 | $92,002 |
| 2022 | $2,334 | $119,158 | $17,010 | $102,148 |
| 2021 | $1,906 | $90,853 | $17,010 | $73,843 |
| 2020 | $1,852 | $86,552 | $17,010 | $69,542 |
| 2019 | $1,710 | $78,180 | $17,010 | $61,170 |
| 2018 | $1,572 | $72,271 | $17,010 | $55,261 |
| 2017 | $1,413 | $66,168 | $17,010 | $49,158 |
| 2016 | $1,329 | $62,248 | $17,010 | $45,238 |
| 2015 | $1,237 | $60,523 | $17,010 | $43,513 |
| 2014 | $1,237 | $58,211 | $17,010 | $41,201 |
Source: Public Records
Map
Nearby Homes
- 520 E Lake St
- 1015 S Donnybrook Ave
- 1212 Belmont Dr
- 319 E 1st St
- 128 Rowland Place
- 145 Rowland Place
- 117 Rowland Place
- 114 E 2nd St
- 107 Rowland Place
- 313 E Charnwood St
- 204 Lindsey Ln
- 1014 S College Ave
- 210 Mockingbird Ln
- 201 W Rusk St
- 403 E Houston St
- 310 W Dobbs St
- 829 S College Ave
- 315 Mockingbird Ln
- 1118 S Fleishel Ave
- 400 Lindsey Ln
Your Personal Tour Guide
Ask me questions while you tour the home.