S
Seller's Agent in 2014
Steven Rouland
RE/MAX

Estimated Value: $189,000 - $230,209
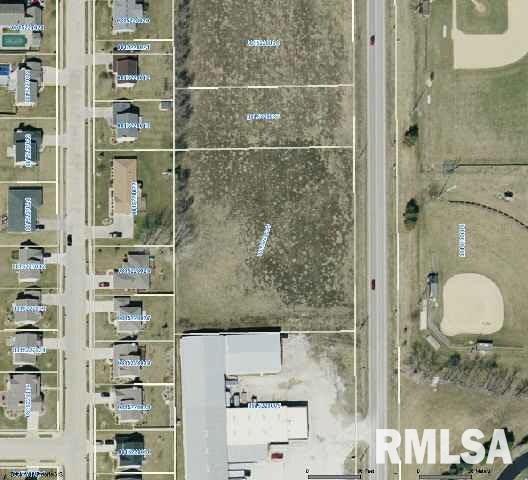
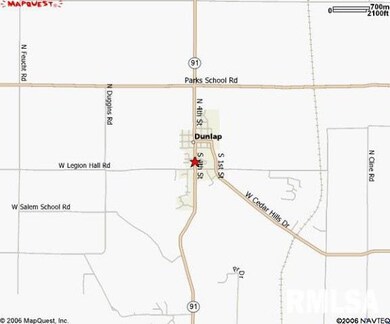
GREAT COMMERCIAL LOCATION ON SOUTH SIDE OF DUNLAP. VISIBILITY PLUS TRAFFIC
Last Agent to Sell the Property
Steven Rouland
RE/MAX Traders Unlimited License #471009664 Listed on: 11/08/2012
Last Buyer's Agent
PAAR-NON RMLSA AGENT
Non-MLS License #0000000000
| Date | Event | Price | List to Sale | Price per Sq Ft |
|---|---|---|---|---|
| 07/31/2014 07/31/14 | Sold | $235,000 | -12.6% | -- |
| 11/13/2013 11/13/13 | Pending | -- | -- | -- |
| 11/08/2012 11/08/12 | For Sale | $269,000 | -- | -- |
| Year | Tax Paid | Tax Assessment Tax Assessment Total Assessment is a certain percentage of the fair market value that is determined by local assessors to be the total taxable value of land and additions on the property. | Land | Improvement |
|---|---|---|---|---|
| 2024 | $3,758 | $52,330 | $5,050 | $47,280 |
| 2023 | $3,562 | $49,360 | $4,760 | $44,600 |
| 2022 | $3,317 | $45,560 | $4,390 | $41,170 |
| 2021 | $3,195 | $43,390 | $4,180 | $39,210 |
| 2020 | $3,132 | $42,130 | $4,060 | $38,070 |
| 2019 | $3,134 | $42,990 | $4,140 | $38,850 |
| 2018 | $3,151 | $43,790 | $4,210 | $39,580 |
| 2017 | $3,314 | $45,620 | $4,390 | $41,230 |
| 2016 | $3,207 | $45,620 | $4,390 | $41,230 |
| 2015 | $3,193 | $43,860 | $4,220 | $39,640 |
| 2014 | $3,128 | $44,510 | $4,280 | $40,230 |
| 2013 | -- | $43,640 | $4,200 | $39,440 |
S
Seller's Agent in 2014
Steven Rouland
RE/MAX
P
Buyer's Agent in 2014
PAAR-NON RMLSA AGENT
Non-MLS
Source: RMLS Alliance
MLS Number: RMAPA7028247
APN: 08-10-200-009
Disclaimer: Certain information contained herein is derived from information provided by parties other than Homes.com. All information provided is deemed reliable, but is not guaranteed to be accurate and should be independently verified.
![]() All data is obtained from various sources and may not have been verified by broker or MLS GRID. Supplied Open House Information is subject to change without notice. All information should be independently reviewed and verified for accuracy. Properties may or may not be listed by the office/agent presenting the information. Some IDX listings have been excluded from this website.IDX information is provided exclusively for personal, non-commercial use, and may not be used for any purpose other than to identify prospective properties consumers may be interested in purchasing. Information is deemed reliable but not guaranteed.
All data is obtained from various sources and may not have been verified by broker or MLS GRID. Supplied Open House Information is subject to change without notice. All information should be independently reviewed and verified for accuracy. Properties may or may not be listed by the office/agent presenting the information. Some IDX listings have been excluded from this website.IDX information is provided exclusively for personal, non-commercial use, and may not be used for any purpose other than to identify prospective properties consumers may be interested in purchasing. Information is deemed reliable but not guaranteed.
Listings courtesy of RMLS Alliance as distributed by MLS GRID.
Based on information submitted to the MLS GRID
Ask me questions while you tour the home.
