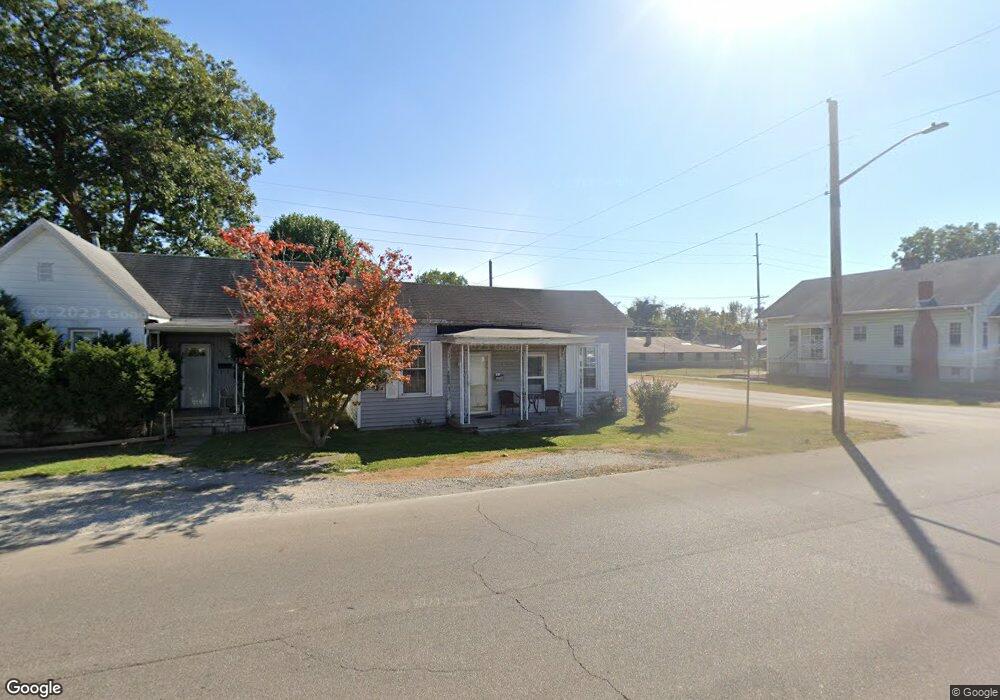
502 E 2nd St Mount Vernon, IN 47620
Estimated Value: $70,000 - $97,000
2
Beds
1
Bath
992
Sq Ft
$85/Sq Ft
Est. Value
About This Home
This home is located at 502 E 2nd St, Mount Vernon, IN 47620 and is currently estimated at $83,869, approximately $84 per square foot. 502 E 2nd St is a home located in Posey County with nearby schools including Mount Vernon Junior High School, Mount Vernon High School, and St. Matthew Elementary School.
Ownership History
Date
Name
Owned For
Owner Type
Purchase Details
Closed on
Nov 5, 2025
Sold by
Moore Shirley
Bought by
Payne Rental Property Llc
Current Estimated Value
Purchase Details
Closed on
Jan 22, 2008
Sold by
Moore Shirley
Bought by
Norrington Lisa
Home Financials for this Owner
Home Financials are based on the most recent Mortgage that was taken out on this home.
Original Mortgage
$28,000
Interest Rate
6.17%
Mortgage Type
Seller Take Back
Purchase Details
Closed on
Jun 6, 2007
Sold by
Duckworth Shawn R
Bought by
Moore Shirley
Create a Home Valuation Report for This Property
The Home Valuation Report is an in-depth analysis detailing your home's value as well as a comparison with similar homes in the area
Home Values in the Area
Average Home Value in this Area
Purchase History
We collect this data history from publicly available records. To have your information removed, we recommend requesting removal directly through your county’s website.
| Date | Buyer | Sale Price | Title Company |
|---|---|---|---|
| Payne Rental Property Llc | -- | First American Title | |
| Norrington Lisa | $28,000 | None Available | |
| Moore Shirley | -- | None Available |
Source: Public Records
Mortgage History
We collect this data history from publicly available records. To have your information removed, we recommend requesting removal directly through your county’s website.
| Date | Status | Borrower | Loan Amount |
|---|---|---|---|
| Previous Owner | Norrington Lisa | $28,000 |
Source: Public Records
Tax History
| Year | Tax Paid | Tax Assessment Tax Assessment Total Assessment is a certain percentage of the fair market value that is determined by local assessors to be the total taxable value of land and additions on the property. | Land | Improvement |
|---|---|---|---|---|
| 2025 | $276 | $36,500 | $6,400 | $30,100 |
| 2024 | $276 | $31,800 | $4,500 | $27,300 |
| 2023 | $253 | $30,200 | $4,500 | $25,700 |
| 2022 | $154 | $28,600 | $4,500 | $24,100 |
| 2021 | $138 | $26,400 | $4,500 | $21,900 |
| 2020 | $198 | $32,400 | $4,600 | $27,800 |
| 2019 | $188 | $31,700 | $4,600 | $27,100 |
| 2018 | $175 | $30,600 | $4,600 | $26,000 |
| 2017 | $164 | $30,500 | $5,100 | $25,400 |
| 2016 | $159 | $31,000 | $5,100 | $25,900 |
| 2014 | $87 | $31,000 | $5,100 | $25,900 |
| 2013 | $87 | $30,900 | $4,800 | $26,100 |
Source: Public Records
Map
Nearby Homes
Your Personal Tour Guide
Ask me questions while you tour the home.