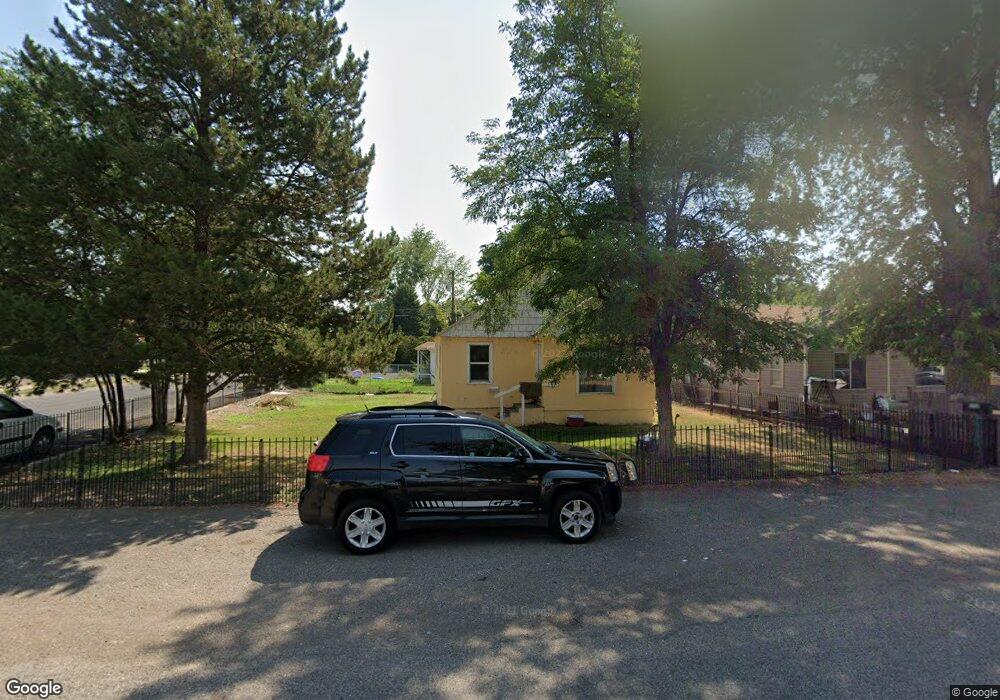
502 Oregon St Gooding, ID 83330
Estimated Value: $166,000 - $186,338
2
Beds
1
Bath
672
Sq Ft
$265/Sq Ft
Est. Value
About This Home
This home is located at 502 Oregon St, Gooding, ID 83330 and is currently estimated at $178,085, approximately $265 per square foot. 502 Oregon St is a home located in Gooding County with nearby schools including Gooding Elementary School, Gooding Middle School, and Gooding High School.
Ownership History
Date
Name
Owned For
Owner Type
Purchase Details
Closed on
Feb 6, 2025
Sold by
Carabez David Rafael and Avina Maricela
Bought by
Soto Maria Nereyda Aval
Current Estimated Value
Purchase Details
Closed on
Oct 23, 2013
Sold by
Strickland Richard B and Strickland Sharon H
Bought by
Carabez David Rafael and Avina Maricela
Home Financials for this Owner
Home Financials are based on the most recent Mortgage that was taken out on this home.
Original Mortgage
$30,000
Interest Rate
4.53%
Mortgage Type
Purchase Money Mortgage
Create a Home Valuation Report for This Property
The Home Valuation Report is an in-depth analysis detailing your home's value as well as a comparison with similar homes in the area
Home Values in the Area
Average Home Value in this Area
Purchase History
| Date | Buyer | Sale Price | Title Company |
|---|---|---|---|
| Soto Maria Nereyda Aval | -- | None Listed On Document | |
| Carabez David Rafael | -- | Land Title And Escrow |
Source: Public Records
Mortgage History
| Date | Status | Borrower | Loan Amount |
|---|---|---|---|
| Previous Owner | Carabez David Rafael | $30,000 |
Source: Public Records
Tax History
| Year | Tax Paid | Tax Assessment Tax Assessment Total Assessment is a certain percentage of the fair market value that is determined by local assessors to be the total taxable value of land and additions on the property. | Land | Improvement |
|---|---|---|---|---|
| 2025 | $705 | $132,965 | $26,143 | $106,822 |
| 2024 | $1,550 | $132,965 | $26,143 | $106,822 |
| 2023 | $1,516 | $126,633 | $24,898 | $101,735 |
| 2022 | $1,491 | $116,551 | $24,898 | $91,653 |
| 2021 | $1,157 | $76,878 | $16,766 | $60,112 |
| 2020 | $1,002 | $55,027 | $9,488 | $45,539 |
| 2019 | $906 | $45,163 | $9,488 | $35,675 |
| 2018 | $850 | $43,464 | $9,488 | $33,976 |
| 2017 | $813 | $0 | $0 | $0 |
| 2016 | $818 | $0 | $0 | $0 |
| 2015 | $831 | $0 | $0 | $0 |
| 2014 | -- | $0 | $0 | $0 |
| 2011 | -- | $0 | $0 | $0 |
Source: Public Records
Map
Nearby Homes
- 506 5th Ave E
- 518 Montana St
- 602 4th Ave E
- 326 Montana St
- 726 Wyoming St
- 217 & 219 Oregon St
- 442 Main St
- 909 Oregon St
- 506 California St
- 530 California St
- 919 9th Ave E
- 729 California St
- 551 10th Ave W
- 302 Nevada St
- 1824 E 1800 S Unit Lot 1 Block 1
- TBD S 2100 E
- TBD Ln
- 1141 Main St
- 1226 Washington St
- 929 Nevada St
Your Personal Tour Guide
Ask me questions while you tour the home.