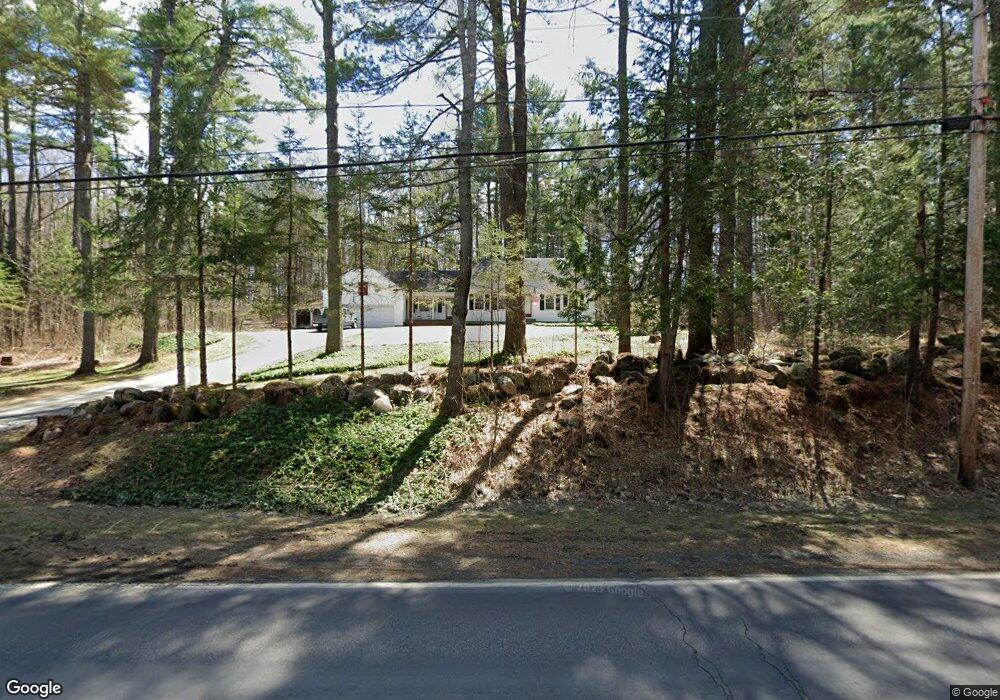
502 Pine St Dover Foxcroft, ME 04426
Estimated Value: $322,744 - $383,000
3
Beds
3
Baths
2,073
Sq Ft
$175/Sq Ft
Est. Value
About This Home
This home is located at 502 Pine St, Dover Foxcroft, ME 04426 and is currently estimated at $362,686, approximately $174 per square foot. 502 Pine St is a home located in Piscataquis County with nearby schools including Se Do Mo Cha Elementary School, Se Do Mo Cha Middle School, and Foxcroft Academy.
Ownership History
Date
Name
Owned For
Owner Type
Purchase Details
Closed on
May 18, 2007
Sold by
Est Taylor Helen T
Bought by
Perkins David R and Perkins Elizabeth S
Current Estimated Value
Home Financials for this Owner
Home Financials are based on the most recent Mortgage that was taken out on this home.
Original Mortgage
$200,000
Outstanding Balance
$118,101
Interest Rate
6.18%
Mortgage Type
Commercial
Estimated Equity
$244,585
Create a Home Valuation Report for This Property
The Home Valuation Report is an in-depth analysis detailing your home's value as well as a comparison with similar homes in the area
Home Values in the Area
Average Home Value in this Area
Purchase History
| Date | Buyer | Sale Price | Title Company |
|---|---|---|---|
| Perkins David R | $1,001 | -- |
Source: Public Records
Mortgage History
| Date | Status | Borrower | Loan Amount |
|---|---|---|---|
| Open | Perkins David R | $200,000 | |
| Closed | Perkins David R | $38,500 |
Source: Public Records
Tax History
| Year | Tax Paid | Tax Assessment Tax Assessment Total Assessment is a certain percentage of the fair market value that is determined by local assessors to be the total taxable value of land and additions on the property. | Land | Improvement |
|---|---|---|---|---|
| 2025 | $4,492 | $265,800 | $40,400 | $225,400 |
| 2024 | $4,032 | $237,200 | $36,700 | $200,500 |
| 2023 | $3,615 | $194,900 | $33,900 | $161,000 |
| 2022 | $3,468 | $173,400 | $31,100 | $142,300 |
| 2021 | $3,487 | $162,200 | $28,200 | $134,000 |
| 2020 | $3,471 | $162,200 | $28,200 | $134,000 |
| 2019 | $3,487 | $162,200 | $28,200 | $134,000 |
| 2018 | $3,439 | $162,200 | $28,200 | $134,000 |
| 2017 | $3,390 | $162,200 | $28,200 | $134,000 |
| 2016 | $3,285 | $162,200 | $28,200 | $134,000 |
| 2015 | $3,017 | $162,200 | $28,200 | $134,000 |
| 2014 | $2,960 | $162,200 | $28,200 | $134,000 |
| 2013 | $2,863 | $162,200 | $28,200 | $134,000 |
Source: Public Records
Map
Nearby Homes
Your Personal Tour Guide
Ask me questions while you tour the home.