503 79th St Houston, TX 77012
Magnolia Park NeighborhoodEstimated Value: $66,000 - $465,000
2
Beds
1
Bath
924
Sq Ft
$264/Sq Ft
Est. Value
About This Home
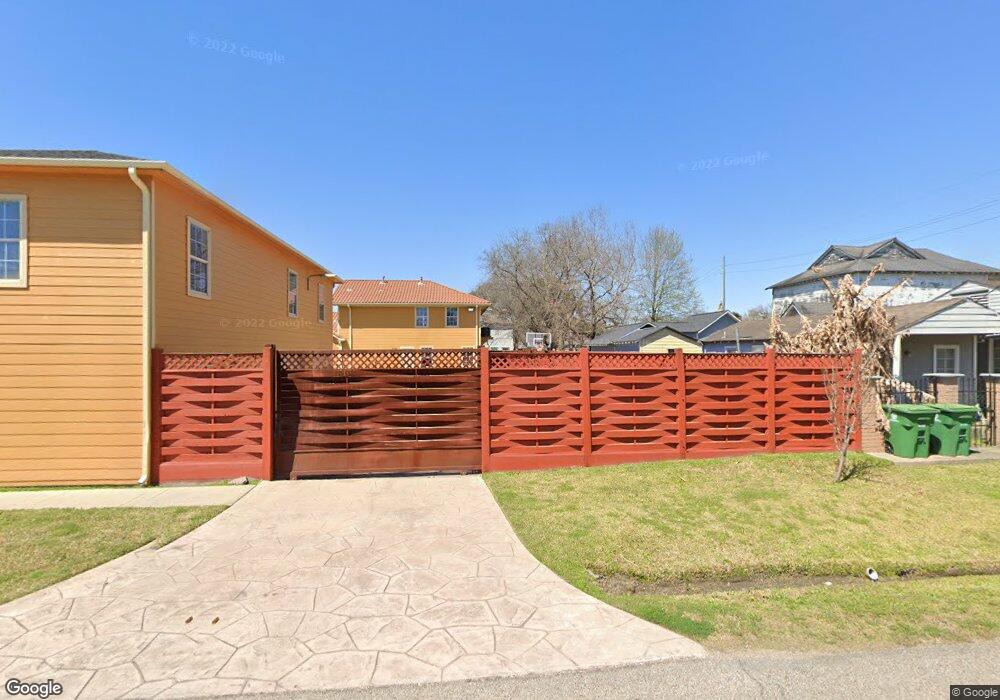
This home is located at 503 79th St, Houston, TX 77012 and is currently estimated at $244,333, approximately $264 per square foot. 503 79th St is a home located in Harris County with nearby schools including Gallegos Elementary School, Edison Middle, and Milby High School.
Ownership History
Date
Name
Owned For
Owner Type
Purchase Details
Closed on
Dec 2, 2025
Sold by
Jimenez Maria De Los Angeles
Bought by
Aviles Jose Luis and Oliva Raul Alberto
Current Estimated Value
Purchase Details
Closed on
Jul 28, 2016
Sold by
Jahangirizadeh Ali
Bought by
Los Angeles Jimenez Maria De
Purchase Details
Closed on
Oct 8, 2015
Sold by
Romo Isabel V
Bought by
Jahangirizadeh Ali
Purchase Details
Closed on
Jun 2, 2015
Sold by
Romo Isabel V and Romo Isabe Vazquez
Bought by
City Of Houston and Hoston Independent School District
Create a Home Valuation Report for This Property
The Home Valuation Report is an in-depth analysis detailing your home's value as well as a comparison with similar homes in the area
Home Values in the Area
Average Home Value in this Area
Purchase History
| Date | Buyer | Sale Price | Title Company |
|---|---|---|---|
| Aviles Jose Luis | -- | None Listed On Document | |
| Los Angeles Jimenez Maria De | -- | None Available | |
| Jahangirizadeh Ali | $8,500 | None Available | |
| City Of Houston | -- | None Available |
Source: Public Records
Tax History
| Year | Tax Paid | Tax Assessment Tax Assessment Total Assessment is a certain percentage of the fair market value that is determined by local assessors to be the total taxable value of land and additions on the property. | Land | Improvement |
|---|---|---|---|---|
| 2025 | $1,177 | $56,250 | $56,250 | -- |
| 2024 | $1,177 | $56,250 | $56,250 | -- |
| 2023 | $1,177 | $56,250 | $56,250 | -- |
| 2022 | $1,058 | $45,000 | $45,000 | $0 |
| 2021 | $699 | $30,000 | $30,000 | $0 |
| 2020 | $1,803 | $70,120 | $30,000 | $40,120 |
| 2019 | $1,850 | $69,003 | $28,125 | $40,878 |
| 2018 | $1,169 | $46,190 | $23,813 | $22,377 |
| 2017 | $1,237 | $46,190 | $23,813 | $22,377 |
| 2016 | $1,161 | $43,339 | $23,813 | $19,526 |
| 2015 | $1,126 | $43,339 | $23,813 | $19,526 |
| 2014 | $1,126 | $43,817 | $23,813 | $20,004 |
Source: Public Records
Map
Nearby Homes
Your Personal Tour Guide
Ask me questions while you tour the home.