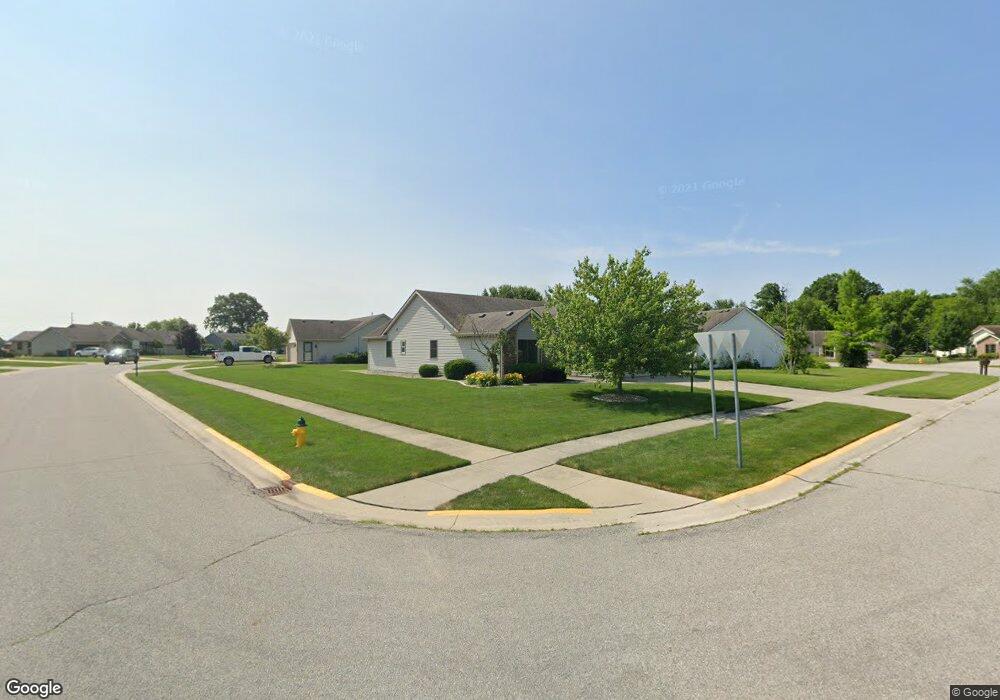
503 Chessie Ct Garrett, IN 46738
Estimated Value: $246,623 - $254,000
3
Beds
2
Baths
1,444
Sq Ft
$174/Sq Ft
Est. Value
About This Home
This home is located at 503 Chessie Ct, Garrett, IN 46738 and is currently estimated at $251,656, approximately $174 per square foot. 503 Chessie Ct is a home located in DeKalb County with nearby schools including J.E. Ober Elementary School, Garrett Middle School, and Garrett High School.
Ownership History
Date
Name
Owned For
Owner Type
Purchase Details
Closed on
May 15, 2009
Sold by
Crabill Wilma B
Bought by
Feagler Mark K
Current Estimated Value
Home Financials for this Owner
Home Financials are based on the most recent Mortgage that was taken out on this home.
Original Mortgage
$8,641
Outstanding Balance
$5,362
Interest Rate
4.84%
Mortgage Type
Credit Line Revolving
Estimated Equity
$246,294
Purchase Details
Closed on
Sep 8, 1998
Sold by
H G Kleeman Enterprises Inc
Bought by
Burrworth Edith M
Create a Home Valuation Report for This Property
The Home Valuation Report is an in-depth analysis detailing your home's value as well as a comparison with similar homes in the area
Home Values in the Area
Average Home Value in this Area
Purchase History
We collect this data history from publicly available records. To have your information removed, we recommend requesting removal directly through your county’s website.
| Date | Buyer | Sale Price | Title Company |
|---|---|---|---|
| Feagler Mark K | $115,000 | Garrett State Bank | |
| Feagler Mark E | -- | None Available | |
| Burrworth Edith M | $103,000 | -- |
Source: Public Records
Mortgage History
We collect this data history from publicly available records. To have your information removed, we recommend requesting removal directly through your county’s website.
| Date | Status | Borrower | Loan Amount |
|---|---|---|---|
| Open | Feagler Mark E | $8,641 | |
| Open | Feagler Mark E | $106,200 |
Source: Public Records
Tax History
| Year | Tax Paid | Tax Assessment Tax Assessment Total Assessment is a certain percentage of the fair market value that is determined by local assessors to be the total taxable value of land and additions on the property. | Land | Improvement |
|---|---|---|---|---|
| 2025 | $1,898 | $228,300 | $40,100 | $188,200 |
| 2024 | $1,656 | $190,000 | $34,900 | $155,100 |
| 2023 | $1,512 | $182,700 | $33,300 | $149,400 |
| 2022 | $1,467 | $155,900 | $27,300 | $128,600 |
| 2021 | $1,298 | $143,100 | $27,300 | $115,800 |
| 2020 | $1,235 | $137,800 | $27,300 | $110,500 |
| 2019 | $1,187 | $134,300 | $27,300 | $107,000 |
| 2018 | $1,170 | $129,800 | $27,300 | $102,500 |
| 2017 | $1,232 | $131,900 | $27,300 | $104,600 |
| 2016 | $1,267 | $133,400 | $27,300 | $106,100 |
| 2014 | $1,182 | $128,000 | $27,300 | $100,700 |
Source: Public Records
Map
Nearby Homes
- 1005 Joanna Ct
- 305 S Colony Dr
- 402 S Colony Dr
- 302 S Colony Dr
- 403 S Colony Dr
- 401 S Colony Dr
- 303 S Colony Dr
- 202 E King St
- 513 E Quincy St
- 312 S Lee St
- 200 E King St
- 215 Latigo Ln
- 818 Gullet Ave
- 805 S Cowen St
- 414 E High St
- 416 N Randolph St
- 218 Saddle Ridge Dr
- 1112 S Ijams St
- 303 Latigo Ln
- 1425 County Road 54
- 507 Chessie Ct
- 514 Columbian Run
- 507 Columbian Run
- 511 Chessie Ct
- 511 Columbian Run
- 518 Columbian Run
- 504 Chessie Ct
- 503 Columbian Run
- 415 Columbian Run
- 508 Chessie Ct
- 515 Columbian Run
- 601 Chessie Ct
- 512 Chessie Ct
- 604 Columbian Run
- 519 Columbian Run
- 516 Chessie Ct
- 601 Columbian Run
- 414 Columbian Run Unit 26
- 414 Columbian Run
- 608 Columbian Run
Your Personal Tour Guide
Ask me questions while you tour the home.