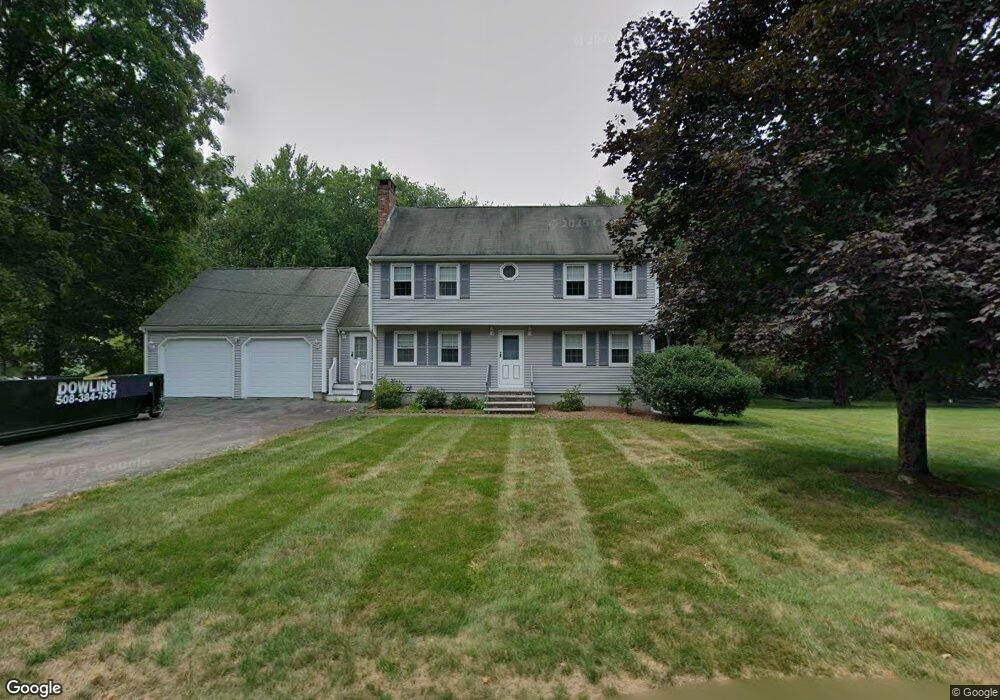
503 Fruit St Mansfield, MA 02048
Estimated Value: $726,374 - $909,000
3
Beds
3
Baths
1,933
Sq Ft
$412/Sq Ft
Est. Value
About This Home
This home is located at 503 Fruit St, Mansfield, MA 02048 and is currently estimated at $795,844, approximately $411 per square foot. 503 Fruit St is a home located in Bristol County with nearby schools including Everett W. Robinson Elementary School, Jordan/Jackson Elementary School, and Harold L. Qualters Middle School.
Ownership History
Date
Name
Owned For
Owner Type
Purchase Details
Closed on
Nov 19, 2010
Sold by
Bezreh George R and Bezreh Dolores A
Bought by
Bezreh Ft
Current Estimated Value
Purchase Details
Closed on
Apr 26, 1995
Sold by
Breen Richard P
Bought by
Bezreh George R and Bezreh Lolores A
Home Financials for this Owner
Home Financials are based on the most recent Mortgage that was taken out on this home.
Original Mortgage
$50,000
Interest Rate
8.33%
Create a Home Valuation Report for This Property
The Home Valuation Report is an in-depth analysis detailing your home's value as well as a comparison with similar homes in the area
Home Values in the Area
Average Home Value in this Area
Purchase History
We collect this data history from publicly available records. To have your information removed, we recommend requesting removal directly through your county’s website.
| Date | Buyer | Sale Price | Title Company |
|---|---|---|---|
| Bezreh Ft | -- | -- | |
| Bezreh George R | $195,500 | -- |
Source: Public Records
Mortgage History
We collect this data history from publicly available records. To have your information removed, we recommend requesting removal directly through your county’s website.
| Date | Status | Borrower | Loan Amount |
|---|---|---|---|
| Previous Owner | Bezreh George R | $68,000 | |
| Previous Owner | Bezreh George R | $50,000 | |
| Previous Owner | Bezreh George R | $70,000 | |
| Previous Owner | Bezreh George R | $140,000 |
Source: Public Records
Tax History
| Year | Tax Paid | Tax Assessment Tax Assessment Total Assessment is a certain percentage of the fair market value that is determined by local assessors to be the total taxable value of land and additions on the property. | Land | Improvement |
|---|---|---|---|---|
| 2025 | $8,080 | $613,500 | $249,500 | $364,000 |
| 2024 | $7,868 | $582,800 | $249,500 | $333,300 |
| 2023 | $7,624 | $541,100 | $249,500 | $291,600 |
| 2022 | $7,330 | $483,200 | $231,000 | $252,200 |
| 2021 | $2,434 | $474,300 | $202,100 | $272,200 |
| 2020 | $7,029 | $457,600 | $192,500 | $265,100 |
| 2019 | $2,528 | $427,800 | $160,300 | $267,500 |
| 2018 | $6,472 | $415,700 | $153,000 | $262,700 |
| 2017 | $2,153 | $404,300 | $148,700 | $255,600 |
| 2016 | $5,623 | $364,900 | $141,400 | $223,500 |
| 2015 | $5,481 | $353,600 | $141,400 | $212,200 |
Source: Public Records
Map
Nearby Homes
- 19 Barberry Rd
- 0 Cobb St
- 0 Brook Pkwy
- 5 Juniper Dr
- 0 Kensington Rd
- 12 Essex St
- 0 Knollwood & 0 Rear Kensington
- 200 Branch St
- 1 Wilbur Terrace Unit 6
- 15 Conrod Ct
- 179 Dean St
- 97 East St
- 343 Godfrey Dr
- 14 Webb Place Unit 1A
- 162 Godfrey Dr Unit 162
- 28 Williams Rd
- 23 Hilltop Ln Unit 1
- 108 Norton Ave Unit 4
- 3 Morse Ct
- 28 Court St
Your Personal Tour Guide
Ask me questions while you tour the home.