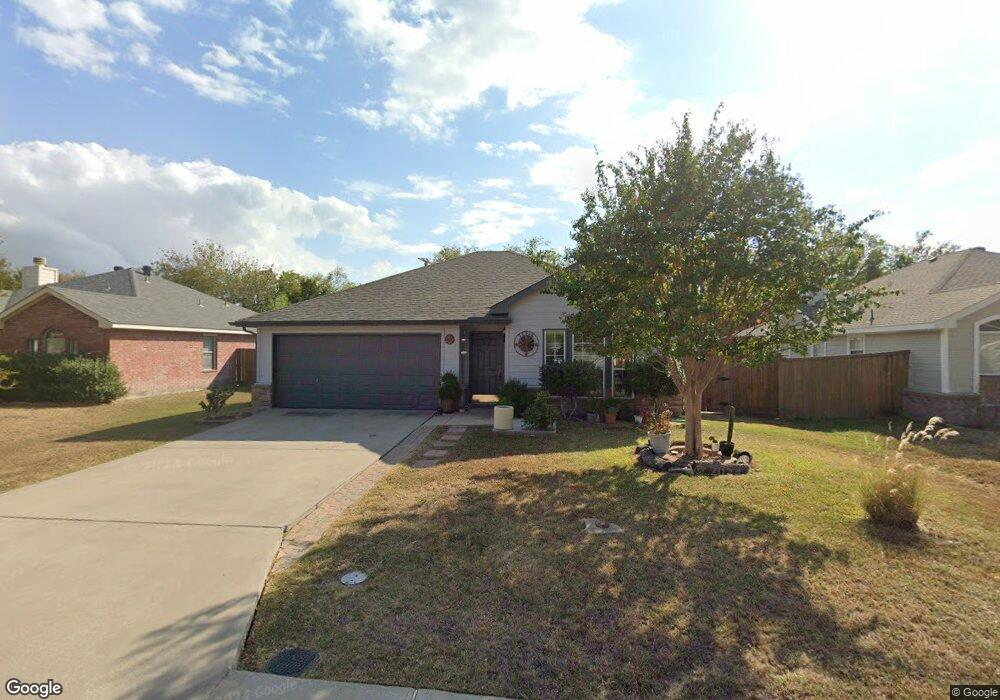
503 Oxford Loop Princeton, TX 75407
Estimated Value: $222,522 - $279,000
2
Beds
2
Baths
1,052
Sq Ft
$247/Sq Ft
Est. Value
About This Home
This home is located at 503 Oxford Loop, Princeton, TX 75407 and is currently estimated at $259,881, approximately $247 per square foot. 503 Oxford Loop is a home located in Collin County with nearby schools including Lacy Elementary School, Southard Middle School, and Princeton High School.
Ownership History
Date
Name
Owned For
Owner Type
Purchase Details
Closed on
Jul 30, 2014
Sold by
Medina Gustavo and Medina Tamara
Bought by
Blanco Adan Becerra and Sanchez Marina
Current Estimated Value
Home Financials for this Owner
Home Financials are based on the most recent Mortgage that was taken out on this home.
Original Mortgage
$82,450
Outstanding Balance
$26,747
Interest Rate
4.2%
Mortgage Type
New Conventional
Estimated Equity
$233,134
Purchase Details
Closed on
Nov 29, 2004
Sold by
Choice Homes Inc
Bought by
Medina Gustavo and Medina Tamara
Home Financials for this Owner
Home Financials are based on the most recent Mortgage that was taken out on this home.
Original Mortgage
$104,509
Interest Rate
5.68%
Mortgage Type
FHA
Purchase Details
Closed on
Aug 10, 2004
Sold by
Calsouth Corp
Bought by
Choice Homes Inc
Home Financials for this Owner
Home Financials are based on the most recent Mortgage that was taken out on this home.
Original Mortgage
$77,257
Interest Rate
6.18%
Mortgage Type
Purchase Money Mortgage
Create a Home Valuation Report for This Property
The Home Valuation Report is an in-depth analysis detailing your home's value as well as a comparison with similar homes in the area
Home Values in the Area
Average Home Value in this Area
Purchase History
| Date | Buyer | Sale Price | Title Company |
|---|---|---|---|
| Blanco Adan Becerra | -- | Rtt | |
| Medina Gustavo | -- | Fnt | |
| Choice Homes Inc | -- | -- |
Source: Public Records
Mortgage History
| Date | Status | Borrower | Loan Amount |
|---|---|---|---|
| Open | Blanco Adan Becerra | $82,450 | |
| Previous Owner | Medina Gustavo | $104,509 | |
| Previous Owner | Choice Homes Inc | $77,257 |
Source: Public Records
Tax History
| Year | Tax Paid | Tax Assessment Tax Assessment Total Assessment is a certain percentage of the fair market value that is determined by local assessors to be the total taxable value of land and additions on the property. | Land | Improvement |
|---|---|---|---|---|
| 2025 | $4,424 | $235,554 | $75,000 | $160,554 |
| 2024 | $4,606 | $239,153 | $75,000 | $164,153 |
| 2023 | $4,606 | $243,207 | $75,000 | $168,207 |
| 2022 | $5,003 | $226,275 | $65,000 | $161,275 |
| 2021 | $3,824 | $165,394 | $50,000 | $115,394 |
| 2020 | $4,057 | $162,209 | $50,000 | $112,209 |
| 2019 | $4,221 | $164,169 | $50,000 | $114,169 |
| 2018 | $3,743 | $144,978 | $40,000 | $104,978 |
| 2017 | $3,301 | $127,844 | $40,000 | $87,844 |
| 2016 | $2,989 | $114,996 | $30,000 | $84,996 |
| 2015 | $1,771 | $98,144 | $30,000 | $68,144 |
Source: Public Records
Map
Nearby Homes
- 112 Wood St Unit A
- 410 E Hazelwood St
- 251 S 2nd St
- 215 N 2nd St
- 300 E Hazelwood St
- 324 Allenwood Dr
- 312 Allenwood Dr
- 911 County Road 456
- 235 Griffith Dr
- 171 Town Park Ave
- 347 Peachtree Ln
- 205 Griffith Dr
- 211 Griffith Dr
- 351 Peachtree Ln
- 207 Griffith Dr
- 190 Balboa Ln
- 203 Griffith Dr
- 186 Balboa Ln
- 310 Boston Dr
- 184 Balboa Ln
- 505 Oxford Loop
- 501 Oxford Loop
- 507 Oxford Loop
- 421 Oxford Loop
- 419 Oxford Loop
- 509 Oxford Loop
- 500 Oxford Loop
- 502 Oxford Loop
- 204 Wood St
- 504 Oxford Loop
- 208 Wood St
- 511 Oxford Loop
- 418 Oxford Loop
- 417 Oxford Loop
- 506 Oxford Loop
- 508 Oxford Loop
- 416 Oxford Loop
- 513 Oxford Loop
- 415 Oxford Loop
- 501 Harvard Dr
Your Personal Tour Guide
Ask me questions while you tour the home.