503 Poplar St Peculiar, MO 64078
Estimated Value: $241,000 - $275,000
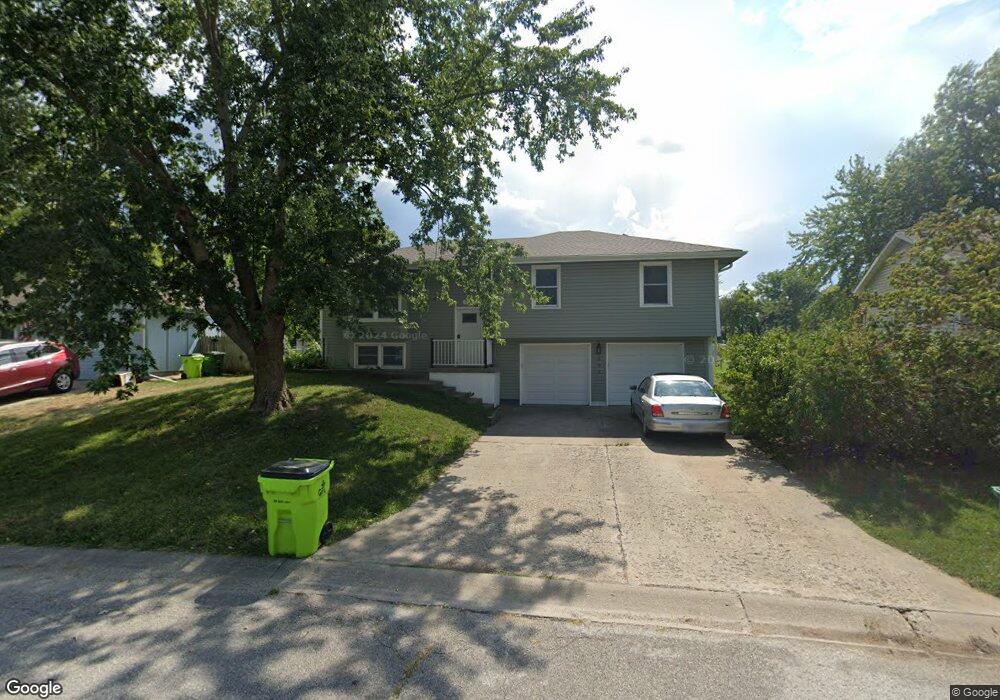
About This Home
This home is located at 503 Poplar St, Peculiar, MO 64078 and is currently estimated at $258,106, approximately $221 per square foot. 503 Poplar St is a home located in Cass County with nearby schools including Peculiar Elementary School, Raymore-Peculiar South Middle School, and Raymore-Peculiar Senior High School.
Ownership History
We collect this data history from publicly available records. To have your information removed, we recommend requesting removal directly through your county’s website.
Purchase Details
Home Financials for this Owner
Home Financials are based on the most recent Mortgage that was taken out on this home.Home Values in the Area
Average Home Value in this Area
Purchase History
We collect this data history from publicly available records. To have your information removed, we recommend requesting removal directly through your county’s website.
| Date | Buyer | Sale Price | Title Company |
|---|---|---|---|
| -- | None Listed On Document |
Mortgage History
We collect this data history from publicly available records. To have your information removed, we recommend requesting removal directly through your county’s website.
| Date | Status | Borrower | Loan Amount |
|---|---|---|---|
| Closed | $167,600 | ||
| Closed | $137,600 |
Tax History
We collect this data history from publicly available records. To have your information removed, we recommend requesting removal directly through your county’s website.
| Year | Tax Paid | Tax Assessment Tax Assessment Total Assessment is a certain percentage of the fair market value that is determined by local assessors to be the total taxable value of land and additions on the property. | Land | Improvement |
|---|---|---|---|---|
| 2025 | $1,818 | $25,850 | $3,380 | $22,470 |
| 2024 | $1,818 | $23,020 | $3,070 | $19,950 |
| 2023 | $1,806 | $23,020 | $3,070 | $19,950 |
| 2022 | $1,647 | $20,320 | $3,070 | $17,250 |
| 2021 | $1,703 | $20,320 | $3,070 | $17,250 |
| 2020 | $1,647 | $19,630 | $3,070 | $16,560 |
| 2019 | $1,644 | $19,630 | $3,070 | $16,560 |
| 2018 | $1,550 | $17,450 | $2,590 | $14,860 |
| 2017 | $1,381 | $17,450 | $2,590 | $14,860 |
| 2016 | $1,381 | $15,500 | $2,590 | $12,910 |
| 2015 | $1,342 | $15,500 | $2,590 | $12,910 |
| 2014 | $1,186 | $15,080 | $2,590 | $12,490 |
| 2013 | -- | $15,080 | $2,590 | $12,490 |
Map
- 402 Poplar St
- 0 N Rd Unit HMS2442105
- 21803 Southcreek Rd
- 21808 Southcreek Rd
- 184 W Center St
- 11120 Highview Rd
- 0 Main St Unit HMS2621638
- Lot 1 Main St
- 0 N Main St Unit HMS2442107
- 21709 North Ridge
- 21710 North Ridge
- 600 Schug Ave
- 21811 Lombardo Ln
- 21809 Lombardo Ln
- 0 E 217th St Unit HMS2621647
- 20100 S St Rt J Hwy
- 21702 N Main St
- 0 Tuscany Pkwy Unit HMS2625744
- 21806 Massa Cir
- 887 Glengera St
Ask me questions while you tour the home.