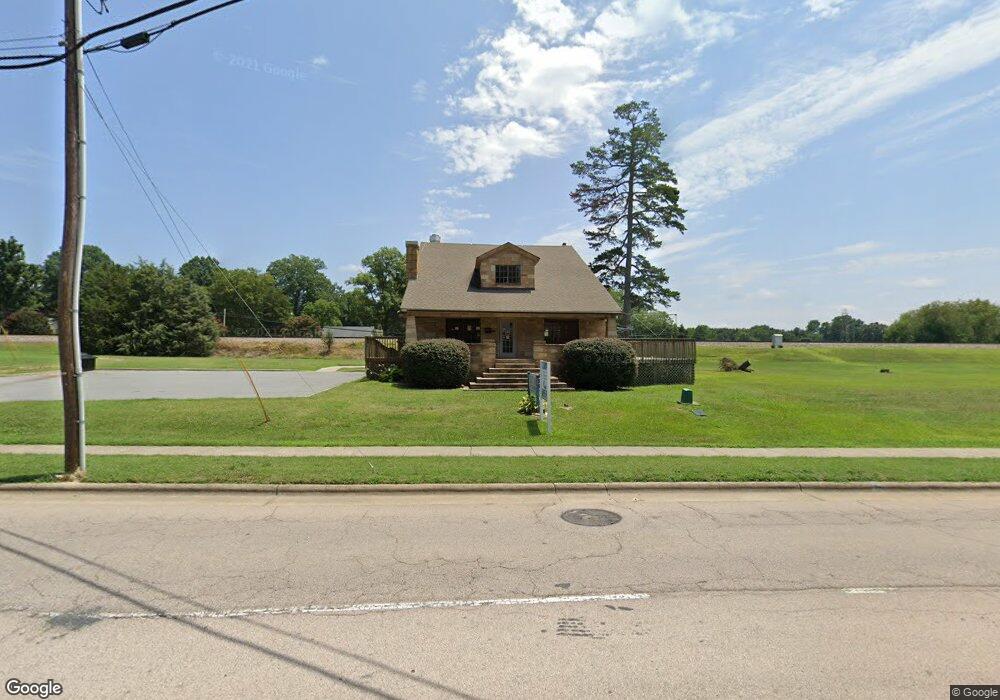
503 S Main St Kannapolis, NC 28081
Estimated Value: $325,691
About This Home
This home is located at 503 S Main St, Kannapolis, NC 28081 and is currently estimated at $325,691, approximately $82 per square foot. 503 S Main St is a home located in Cabarrus County with nearby schools including Fred L. Wilson Elementary School, Kannapolis Middle, and A.L. Brown High School.
Ownership History
We collect this data history from publicly available records. To have your information removed, we recommend requesting removal directly through your county’s website.
Purchase Details
Purchase Details
Home Financials for this Owner
Home Financials are based on the most recent Mortgage that was taken out on this home.Home Values in the Area
Average Home Value in this Area
Purchase History
We collect this data history from publicly available records. To have your information removed, we recommend requesting removal directly through your county’s website.
| Date | Buyer | Sale Price | Title Company |
|---|---|---|---|
| $290,000 | -- | ||
| $290,000 | None Listed On Document | ||
| $155,000 | -- |
Mortgage History
We collect this data history from publicly available records. To have your information removed, we recommend requesting removal directly through your county’s website.
| Date | Status | Borrower | Loan Amount |
|---|---|---|---|
| Previous Owner | $192,000 |
Tax History
We collect this data history from publicly available records. To have your information removed, we recommend requesting removal directly through your county’s website.
| Year | Tax Paid | Tax Assessment Tax Assessment Total Assessment is a certain percentage of the fair market value that is determined by local assessors to be the total taxable value of land and additions on the property. | Land | Improvement |
|---|---|---|---|---|
| 2025 | $4,677 | $411,910 | $224,730 | $187,180 |
| 2024 | $4,677 | $411,910 | $224,730 | $187,180 |
| 2023 | $6,326 | $461,760 | $277,260 | $184,500 |
| 2022 | $6,326 | $461,760 | $277,260 | $184,500 |
| 2021 | $6,326 | $461,760 | $277,260 | $184,500 |
| 2020 | $6,326 | $461,760 | $277,260 | $184,500 |
| 2019 | $3,850 | $281,050 | $162,660 | $118,390 |
| 2018 | $3,794 | $281,050 | $162,660 | $118,390 |
| 2017 | $3,738 | $281,050 | $162,660 | $118,390 |
| 2016 | $3,738 | $219,900 | $113,850 | $106,050 |
| 2015 | $4,205 | $333,750 | $227,700 | $106,050 |
| 2014 | $4,205 | $333,750 | $227,700 | $106,050 |
Map
- 410 S Rose Ave
- 317 S Ridge Ave
- 400 S Rose Ave
- 5940 Mantle Way
- 229 W G St
- 315 S Rose Ave
- 417 York Ave
- 5780 Mantle Way
- 306 York Ave
- 3150 Baines Ct
- 500 Broad St
- 515 Copel St
- 707 Oakshade Ave Unit 51
- 605 Huron St
- 5840 Pittmon Ln Unit 3
- 5850 Pittmon Ln Unit 2
- 5820 Pittmon Ln Unit 5
- 600 Bethpage Rd
- 602 Bethpage Rd
- 616 Barlow Ave
Ask me questions while you tour the home.