Estimated Value: $52,767 - $94,000
Studio
--
Bath
--
Sq Ft
0.4
Acres Lot
About This Home
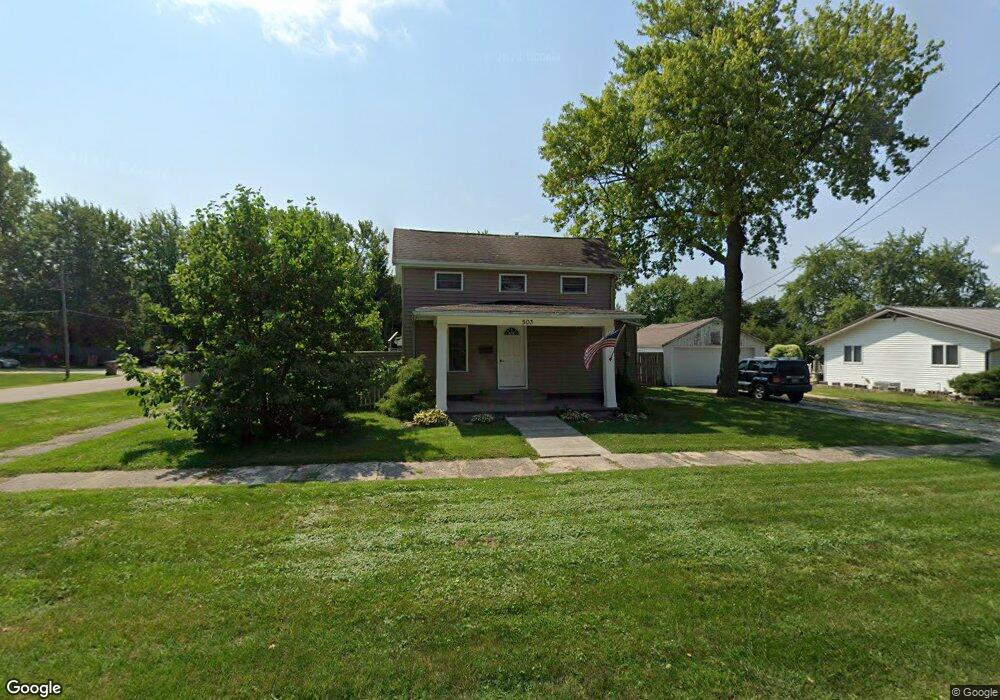
This home is located at 503 SW 3rd St, Galva, IL 61434 and is currently estimated at $71,442. 503 SW 3rd St is a home located in Henry County with nearby schools including Galva Elementary School and Galva Junior/Senior High School.
Ownership History
Date
Name
Owned For
Owner Type
Purchase Details
Closed on
Jan 9, 2009
Sold by
Brock Gary E
Bought by
Larson Chad S
Current Estimated Value
Home Financials for this Owner
Home Financials are based on the most recent Mortgage that was taken out on this home.
Original Mortgage
$30,000
Interest Rate
6.5%
Mortgage Type
Purchase Money Mortgage
Create a Home Valuation Report for This Property
The Home Valuation Report is an in-depth analysis detailing your home's value as well as a comparison with similar homes in the area
Home Values in the Area
Average Home Value in this Area
Purchase History
We collect this data history from publicly available records. To have your information removed, we recommend requesting removal directly through your county’s website.
| Date | Buyer | Sale Price | Title Company |
|---|---|---|---|
| Larson Chad S | $25,000 | None Available |
Source: Public Records
Mortgage History
We collect this data history from publicly available records. To have your information removed, we recommend requesting removal directly through your county’s website.
| Date | Status | Borrower | Loan Amount |
|---|---|---|---|
| Previous Owner | Larson Chad S | $30,000 |
Source: Public Records
Tax History
| Year | Tax Paid | Tax Assessment Tax Assessment Total Assessment is a certain percentage of the fair market value that is determined by local assessors to be the total taxable value of land and additions on the property. | Land | Improvement |
|---|---|---|---|---|
| 2024 | $950 | $15,590 | $3,745 | $11,845 |
| 2023 | $911 | $15,062 | $3,618 | $11,444 |
| 2022 | $764 | $13,448 | $3,230 | $10,218 |
| 2021 | $603 | $11,745 | $2,821 | $8,924 |
| 2020 | $619 | $11,854 | $2,847 | $9,007 |
| 2019 | $697 | $12,759 | $3,064 | $9,695 |
| 2018 | $662 | $12,388 | $2,975 | $9,413 |
| 2017 | $625 | $12,063 | $2,897 | $9,166 |
| 2016 | $633 | $12,003 | $2,883 | $9,120 |
| 2015 | $629 | $12,003 | $2,883 | $9,120 |
| 2013 | $629 | $12,124 | $2,912 | $9,212 |
Source: Public Records
Map
Nearby Homes
- 110 SW 7th St
- 404 SE 1st St
- 402 NE 2nd Ave
- 417 NE 2nd St
- 620 NE 1st Ave
- 760 SE 1st St
- 1129 NW 5th Ave
- 2001 Olof Krans Ave
- 2103 Olof Krans Ave
- 1200 E James B Young Rd
- 2321 Olof Krans Ave
- 2320 Olof Krans Ave
- 2440 Olof Krans Ave
- 2439 Olof Krans Ave
- 2549 Olof Krans Ave
- 2659 Olof Krans Ave
- 2932 Illinois 17
- 2769 Olof Krans Ave
- 2832 Illinois 17
- 607 E Main St
Your Personal Tour Guide
Ask me questions while you tour the home.