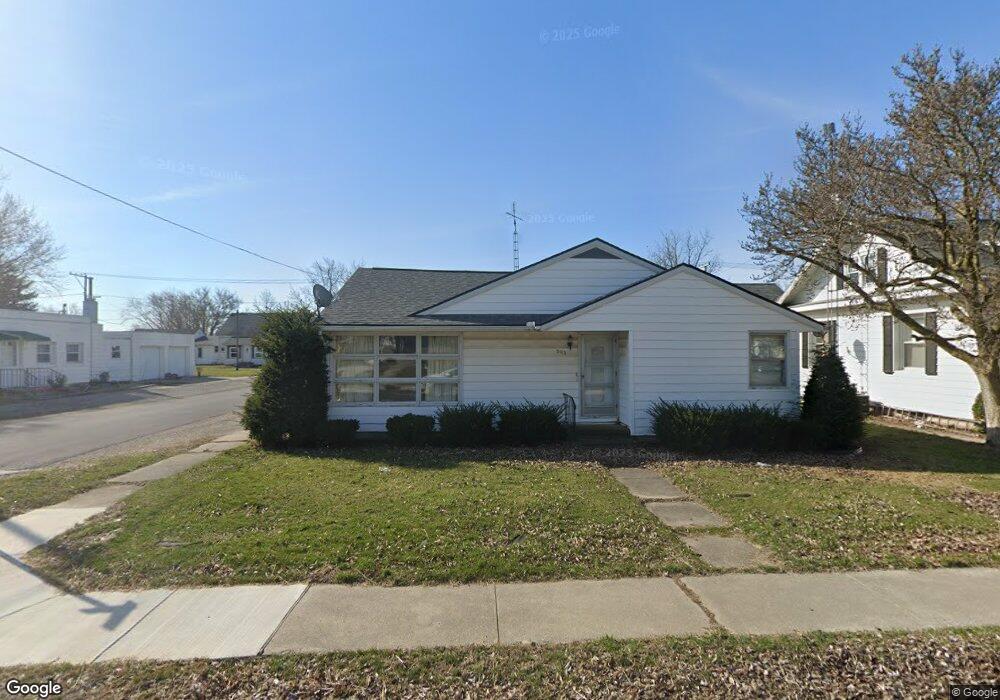
503 W Main St Leipsic, OH 45856
Estimated Value: $145,760 - $178,000
3
Beds
2
Baths
1,859
Sq Ft
$90/Sq Ft
Est. Value
About This Home
This home is located at 503 W Main St, Leipsic, OH 45856 and is currently estimated at $166,690, approximately $89 per square foot. 503 W Main St is a home located in Putnam County with nearby schools including Leipsic Elementary School, Leipsic High School, and St. Mary Elementary School.
Ownership History
Date
Name
Owned For
Owner Type
Purchase Details
Closed on
Aug 14, 2025
Sold by
Dwenger Raymond A
Bought by
Dwenger Raymond A and Punches Sheila Jo
Current Estimated Value
Purchase Details
Closed on
Jun 24, 2021
Sold by
Bernard & Maragaret Dwenger Fmaily Llc
Bought by
Dewenger Raymond A
Purchase Details
Closed on
May 19, 2010
Sold by
Bernard & Margaret Dwenger Family Llc
Bought by
Dwenger Raymond A
Purchase Details
Closed on
Apr 20, 2005
Sold by
Bernard & Margaret Dwenger Family Llc
Bought by
Dwenger Bernard W and Dwenger Margaret
Purchase Details
Closed on
Dec 7, 2003
Bought by
Dwenger Margaret Le
Create a Home Valuation Report for This Property
The Home Valuation Report is an in-depth analysis detailing your home's value as well as a comparison with similar homes in the area
Purchase History
| Date | Buyer | Sale Price | Title Company |
|---|---|---|---|
| Dwenger Raymond A | -- | None Listed On Document | |
| Dwenger Raymond A | -- | None Listed On Document | |
| Dewenger Raymond A | -- | None Available | |
| Dwenger Raymond A | -- | None Available | |
| Dwenger Bernard W | -- | None Available | |
| Bernard & Margaret Dwenger Family Llc | -- | None Available | |
| Dwenger Margaret Le | -- | -- |
Source: Public Records
Tax History
| Year | Tax Paid | Tax Assessment Tax Assessment Total Assessment is a certain percentage of the fair market value that is determined by local assessors to be the total taxable value of land and additions on the property. | Land | Improvement |
|---|---|---|---|---|
| 2025 | $1,285 | $42,140 | $3,850 | $38,290 |
| 2024 | $1,350 | $42,140 | $3,850 | $38,290 |
| 2023 | $1,390 | $32,690 | $2,980 | $29,710 |
| 2022 | $1,322 | $32,691 | $2,979 | $29,712 |
| 2021 | $1,329 | $32,690 | $2,980 | $29,710 |
| 2020 | $1,322 | $23,310 | $2,630 | $20,680 |
| 2019 | $1,035 | $26,500 | $2,980 | $23,520 |
| 2018 | $1,014 | $26,500 | $2,980 | $23,520 |
| 2017 | $826 | $26,500 | $2,980 | $23,520 |
| 2016 | $826 | $23,310 | $2,630 | $20,680 |
| 2015 | $812 | $23,310 | $2,630 | $20,680 |
| 2014 | $792 | $23,310 | $2,630 | $20,680 |
| 2013 | $817 | $23,310 | $2,630 | $20,680 |
Source: Public Records
Map
Nearby Homes
Your Personal Tour Guide
Ask me questions while you tour the home.