504 Elliott St Arlington, TX 76013
Downtown Arlington NeighborhoodEstimated Value: $215,239 - $284,000
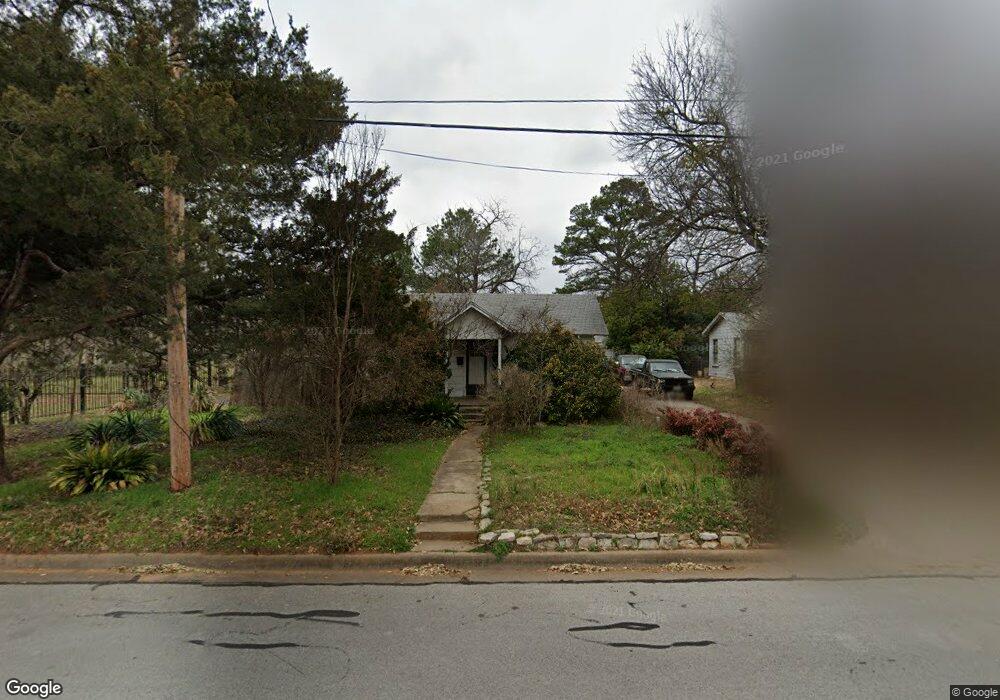
About This Home
This home is located at 504 Elliott St, Arlington, TX 76013 and is currently estimated at $249,620, approximately $302 per square foot. 504 Elliott St is a home located in Tarrant County with nearby schools including Swift Elementary School, Bailey Jr. High School, and Arlington High School.
Ownership History
We collect this data history from publicly available records. To have your information removed, we recommend requesting removal directly through your county’s website.
Purchase Details
Home Financials for this Owner
Home Financials are based on the most recent Mortgage that was taken out on this home.Home Values in the Area
Average Home Value in this Area
Purchase History
We collect this data history from publicly available records. To have your information removed, we recommend requesting removal directly through your county’s website.
| Date | Buyer | Sale Price | Title Company |
|---|---|---|---|
| -- | -- |
Mortgage History
We collect this data history from publicly available records. To have your information removed, we recommend requesting removal directly through your county’s website.
| Date | Status | Borrower | Loan Amount |
|---|---|---|---|
| Closed | $27,000 |
Tax History
We collect this data history from publicly available records. To have your information removed, we recommend requesting removal directly through your county’s website.
| Year | Tax Paid | Tax Assessment Tax Assessment Total Assessment is a certain percentage of the fair market value that is determined by local assessors to be the total taxable value of land and additions on the property. | Land | Improvement |
|---|---|---|---|---|
| 2025 | $3,891 | $178,000 | $82,150 | $95,850 |
| 2024 | $3,890 | $178,000 | $82,150 | $95,850 |
| 2023 | $4,620 | $209,380 | $72,150 | $137,230 |
| 2022 | $3,873 | $155,732 | $52,124 | $103,608 |
| 2021 | $3,175 | $122,190 | $30,375 | $91,815 |
| 2020 | $2,888 | $115,005 | $30,375 | $84,630 |
| 2019 | $2,858 | $110,000 | $30,000 | $80,000 |
| 2018 | $2,598 | $100,000 | $20,000 | $80,000 |
| 2017 | $2,560 | $96,182 | $20,000 | $76,182 |
| 2016 | $1,982 | $74,452 | $20,000 | $54,452 |
| 2015 | $1,435 | $54,400 | $20,000 | $34,400 |
| 2014 | $1,435 | $54,400 | $20,000 | $34,400 |
Map
- 117 Paxton Cir
- 410 S Davis Dr
- 1709 Norwood Ln
- 149 Parkwood Ave
- 370 Westview Terrace
- 1608 Freeman Ct
- 306 Westview Terrace
- 1723 Crest Grove Dr Unit 120B
- 1932 Channing Park Dr
- 126 Varsity Cir
- 2006 Channing Park Dr
- 401 Magnolia St
- 1905 Easy St
- 627 Mcqueary St
- 512 Ashmede Ct
- 810 Arthur Dr
- 131 Garden Ct E
- 1310 W Cedar St
- 1400 Bennett Dr
- 1916 Valley Ln
Ask me questions while you tour the home.