
Seller's Agent in 2012
Nell Winston, CRS GRI
Howard Hanna
(330) 343-7684
67 Total Sales
Estimated Value: $130,000 - $204,000
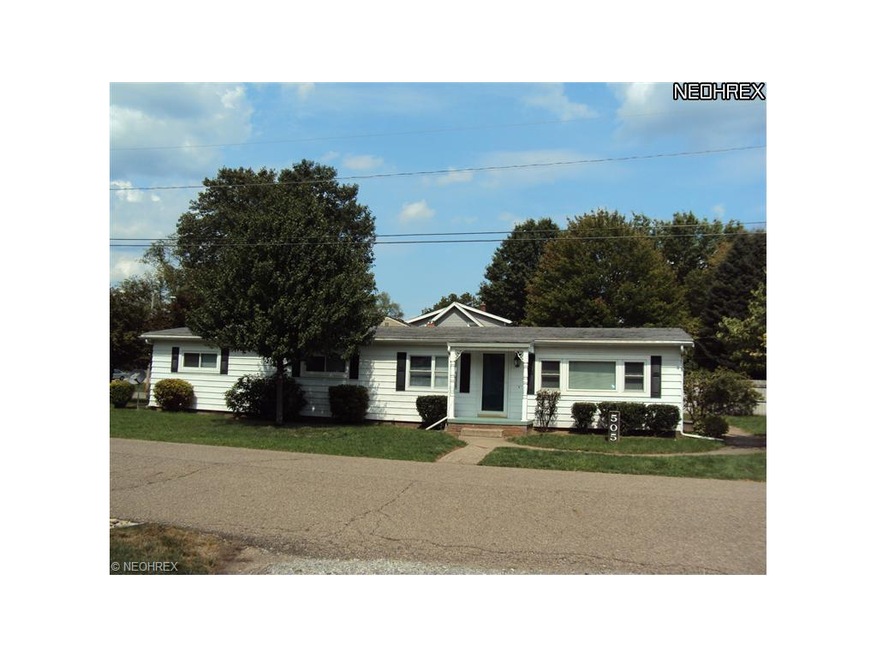
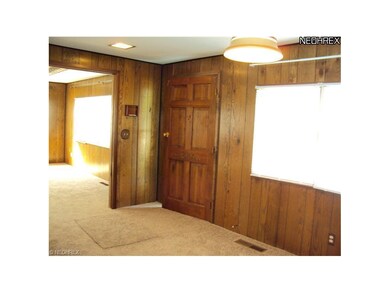
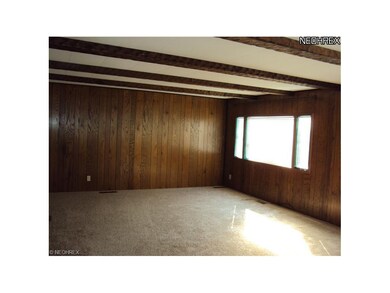
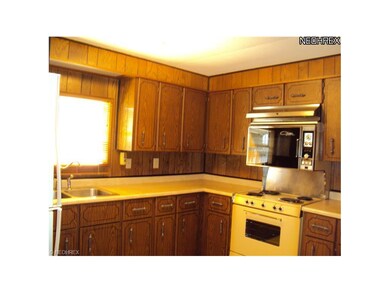
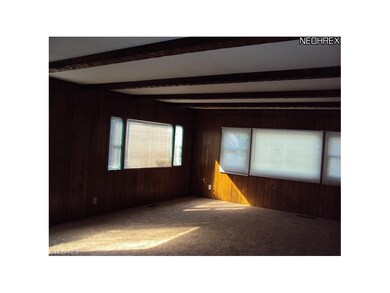
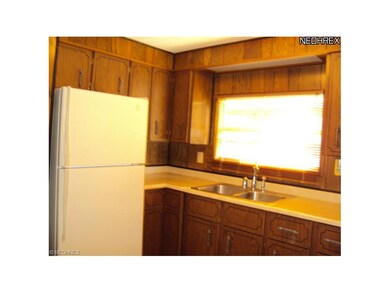
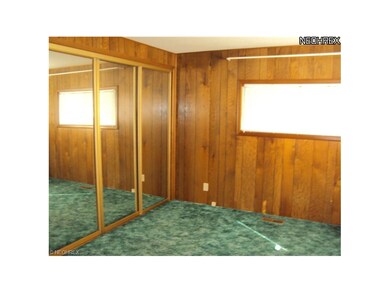
Why pay rent!! Take a look at this nice package. Maintenance free ranch style home. 3 bedrooms, 1 bath open concept. New carpet in living room, dining room and hallways. First floor laundry. Applicances in kitchen to stay. Large corner lot. Well landscaped. Detached garage - plenty of room for storage and workshop. Cozy covered porch and patio. Partially fenced yard for privacy. Come take a look and enjoy.
Last Agent to Sell the Property
Howard Hanna License #350646 Listed on: 08/15/2012
We collect this data history from publicly available records. To have your information removed, we recommend requesting removal directly through your county’s website.
We collect this data history from publicly available records. To have your information removed, we recommend requesting removal directly through your county’s website.
| Date | Buyer | Sale Price | Title Company |
|---|---|---|---|
| $53,500 | Alban Title | ||
| $34,000 | -- |
We collect this data history from publicly available records. To have your information removed, we recommend requesting removal directly through your county’s website.
| Date | Event | Price | List to Sale | Price per Sq Ft |
|---|---|---|---|---|
| 09/05/2012 09/05/12 | Sold | $53,500 | -14.4% | $38 / Sq Ft |
| 08/27/2012 08/27/12 | Pending | -- | -- | -- |
| 08/15/2012 08/15/12 | For Sale | $62,500 | -- | $44 / Sq Ft |
We collect this data history from publicly available records. To have your information removed, we recommend requesting removal directly through your county’s website.
| Year | Tax Paid | Tax Assessment Tax Assessment Total Assessment is a certain percentage of the fair market value that is determined by local assessors to be the total taxable value of land and additions on the property. | Land | Improvement |
|---|---|---|---|---|
| 2025 | $1,405 | $35,490 | $14,810 | $20,680 |
| 2024 | $1,196 | $77,870 | $32,500 | $45,370 |
| 2023 | $1,196 | $77,870 | $32,500 | $45,370 |
| 2022 | $1,210 | $27,255 | $11,375 | $15,880 |
| 2021 | $1,053 | $22,271 | $7,434 | $14,837 |
| 2020 | $1,054 | $22,271 | $7,434 | $14,837 |
| 2019 | $1,061 | $22,271 | $7,434 | $14,837 |
| 2018 | $951 | $18,870 | $6,300 | $12,570 |
| 2017 | $951 | $18,870 | $6,300 | $12,570 |
| 2016 | $953 | $18,870 | $6,300 | $12,570 |
| 2014 | $1,056 | $22,670 | $7,090 | $15,580 |
| 2013 | $1,070 | $22,670 | $7,090 | $15,580 |
Seller's Agent in 2012
Nell Winston, CRS GRI
Howard Hanna
(330) 343-7684
67 Total Sales
Buyer's Agent in 2012
Greg Norris
Howard Hanna
(330) 447-3068
63 Total Sales
Source: MLS Now
MLS Number: 3344143
APN: 1504238000
Disclaimer: Certain information contained herein is derived from information provided by parties other than Homes.com. All information provided is deemed reliable, but is not guaranteed to be accurate and should be independently verified.
![]() IDX information is provided exclusively for personal, non-commercial use, and may not be used for any purpose other than to identify prospective properties consumers may be interested in purchasing. Information is deemed reliable but not guaranteed.
IDX information is provided exclusively for personal, non-commercial use, and may not be used for any purpose other than to identify prospective properties consumers may be interested in purchasing. Information is deemed reliable but not guaranteed.
Ask me questions while you tour the home.