Estimated Value: $171,000 - $185,000
2
Beds
2
Baths
1,092
Sq Ft
$163/Sq Ft
Est. Value
About This Home
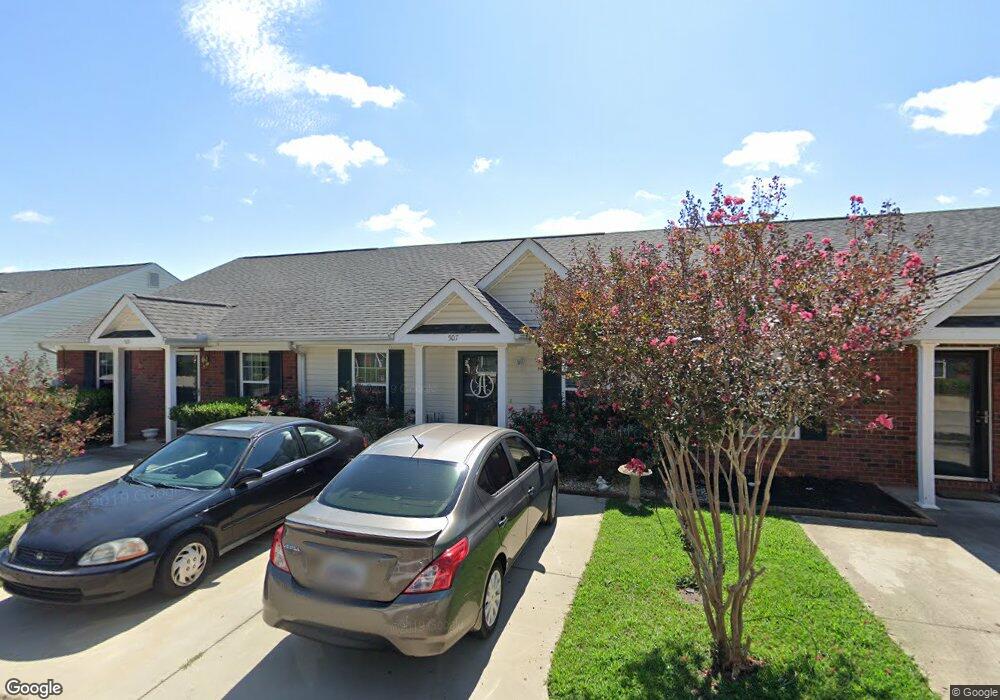
This home is located at 507 Edgecliff Ln, Evans, GA 30809 and is currently estimated at $177,578, approximately $162 per square foot. 507 Edgecliff Ln is a home located in Columbia County with nearby schools including Riverside Elementary School, Riverside Middle School, and Greenbrier High School.
Ownership History
Date
Name
Owned For
Owner Type
Purchase Details
Closed on
Feb 26, 2021
Sold by
Vandelay Property Georgia Llc
Bought by
Vanbladel Gregory
Current Estimated Value
Purchase Details
Closed on
May 10, 2018
Sold by
Scott Joost
Bought by
Vandelay Property Georgia Llc
Home Financials for this Owner
Home Financials are based on the most recent Mortgage that was taken out on this home.
Original Mortgage
$71,250
Interest Rate
4.4%
Mortgage Type
Unknown
Purchase Details
Closed on
May 10, 2007
Sold by
Austin Ann S
Bought by
Joost Scott F
Purchase Details
Closed on
Jun 15, 2006
Sold by
Gb Development Llc
Bought by
Austin Ann S
Home Financials for this Owner
Home Financials are based on the most recent Mortgage that was taken out on this home.
Original Mortgage
$75,600
Interest Rate
6.57%
Mortgage Type
New Conventional
Create a Home Valuation Report for This Property
The Home Valuation Report is an in-depth analysis detailing your home's value as well as a comparison with similar homes in the area
Home Values in the Area
Average Home Value in this Area
Purchase History
We collect this data history from publicly available records. To have your information removed, we recommend requesting removal directly through your county’s website.
| Date | Buyer | Sale Price | Title Company |
|---|---|---|---|
| Vanbladel Gregory | -- | -- | |
| Vpga01 Llc | -- | -- | |
| Vandelay Property Georgia Llc | $95,000 | -- | |
| Joost Scott F | $87,000 | -- | |
| Austin Ann S | $87,000 | -- |
Source: Public Records
Mortgage History
We collect this data history from publicly available records. To have your information removed, we recommend requesting removal directly through your county’s website.
| Date | Status | Borrower | Loan Amount |
|---|---|---|---|
| Previous Owner | Vandelay Property Georgia Llc | $71,250 | |
| Previous Owner | Austin Ann S | $75,600 |
Source: Public Records
Tax History
| Year | Tax Paid | Tax Assessment Tax Assessment Total Assessment is a certain percentage of the fair market value that is determined by local assessors to be the total taxable value of land and additions on the property. | Land | Improvement |
|---|---|---|---|---|
| 2025 | $1,733 | $72,702 | $14,104 | $58,598 |
| 2024 | $1,735 | $69,467 | $13,404 | $56,063 |
| 2023 | $1,735 | $60,275 | $12,604 | $47,671 |
| 2022 | $1,364 | $52,512 | $10,504 | $42,008 |
| 2021 | $1,188 | $43,736 | $9,004 | $34,732 |
| 2020 | $1,059 | $38,168 | $8,004 | $30,164 |
| 2019 | $1,023 | $36,864 | $7,504 | $29,360 |
| 2018 | $996 | $35,759 | $7,204 | $28,555 |
| 2017 | $951 | $34,035 | $7,004 | $27,031 |
| 2016 | $878 | $32,595 | $6,680 | $25,915 |
| 2015 | $835 | $30,951 | $6,380 | $24,571 |
| 2014 | $860 | $31,475 | $6,680 | $24,795 |
Source: Public Records
Map
Nearby Homes
- 626 Brook Trail
- 231 High Point Way
- 4832 Washington Rd
- 1434 Knob Hill Cir
- 4535 Willie Daniel Dr
- 746 Avrett Cir
- 961 Halali Farm Rd
- 2967 William Few Pkwy
- 1 Harding Ct
- 996 Woody Hill Cir
- 5107 Windmill Place
- 503 Avrett Ct
- 211 Nicholson St
- 819 Windmill Crossing
- 1006 Mitchell Ln
- 1005 Mitchell Ln
- 657 Cornerstone Place
- 967 Windmill Ln
- 5130 Windmill Place
- 3511 Hilltop Trail
- 504 Edgecliff Ln
- 502 Edgecliff Ln
- 506 Edgecliff Ln
- 508 Edgecliff Ln
- 510 Edgecliff Ln
- 503 Edgecliff Ln
- 505 Edgecliff Ln
- 501 Edgecliff Ln
- 509 Edgecliff Ln
- 861 Shannon Ln
- 511 Edgecliff Ln
- 513 Edgecliff Ln
- 515 Edgecliff Ln
- 518 Edgecliff Ln
- 610 Brook Trail
- 608 Brook Trail
- 614 Brook Trail
- 606 Brook Trail
- 616 Brook Trail
- 517 Edgecliff Ln
Your Personal Tour Guide
Ask me questions while you tour the home.