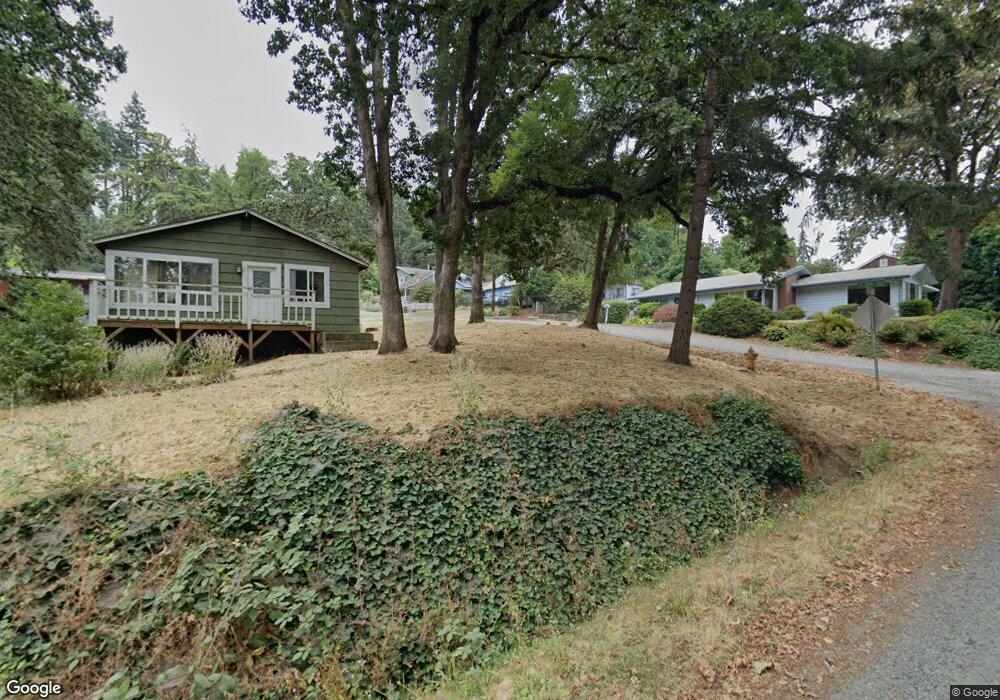
508 S 5th St Springfield, OR 97477
Washburne District NeighborhoodEstimated Value: $350,000 - $406,000
3
Beds
1
Bath
1,232
Sq Ft
$310/Sq Ft
Est. Value
About This Home
This home is located at 508 S 5th St, Springfield, OR 97477 and is currently estimated at $381,322, approximately $309 per square foot. 508 S 5th St is a home located in Lane County with nearby schools including Two Rivers Dos Rios Elementary School, Hamlin Middle School, and Springfield High School.
Ownership History
Date
Name
Owned For
Owner Type
Purchase Details
Closed on
Apr 20, 2017
Sold by
Swanston David
Bought by
Tafoya Richard R
Current Estimated Value
Home Financials for this Owner
Home Financials are based on the most recent Mortgage that was taken out on this home.
Original Mortgage
$151,920
Outstanding Balance
$126,120
Interest Rate
4.21%
Mortgage Type
New Conventional
Estimated Equity
$255,202
Purchase Details
Closed on
Apr 7, 1998
Sold by
Barajas Colleen
Bought by
Paige Lennon and Paige Christine
Create a Home Valuation Report for This Property
The Home Valuation Report is an in-depth analysis detailing your home's value as well as a comparison with similar homes in the area
Home Values in the Area
Average Home Value in this Area
Purchase History
We collect this data history from publicly available records. To have your information removed, we recommend requesting removal directly through your county’s website.
| Date | Buyer | Sale Price | Title Company |
|---|---|---|---|
| Tafoya Richard R | $189,900 | Cascade Title Company | |
| Paige Lennon | $26,000 | Fidelity National Title Co |
Source: Public Records
Mortgage History
We collect this data history from publicly available records. To have your information removed, we recommend requesting removal directly through your county’s website.
| Date | Status | Borrower | Loan Amount |
|---|---|---|---|
| Open | Tafoya Richard R | $151,920 |
Source: Public Records
Tax History
| Year | Tax Paid | Tax Assessment Tax Assessment Total Assessment is a certain percentage of the fair market value that is determined by local assessors to be the total taxable value of land and additions on the property. | Land | Improvement |
|---|---|---|---|---|
| 2025 | $2,605 | $142,062 | -- | -- |
| 2024 | $2,563 | $137,925 | -- | -- |
| 2023 | $2,563 | $133,908 | $0 | $0 |
| 2022 | $2,374 | $130,008 | $0 | $0 |
| 2021 | $2,331 | $126,222 | $0 | $0 |
| 2020 | $2,263 | $122,546 | $0 | $0 |
| 2019 | $2,195 | $118,977 | $0 | $0 |
| 2018 | $2,069 | $112,148 | $0 | $0 |
| 2017 | $1,990 | $112,148 | $0 | $0 |
| 2016 | $1,948 | $108,882 | $0 | $0 |
| 2015 | $1,892 | $105,711 | $0 | $0 |
| 2014 | $1,864 | $102,632 | $0 | $0 |
Source: Public Records
Map
Nearby Homes
Your Personal Tour Guide
Ask me questions while you tour the home.