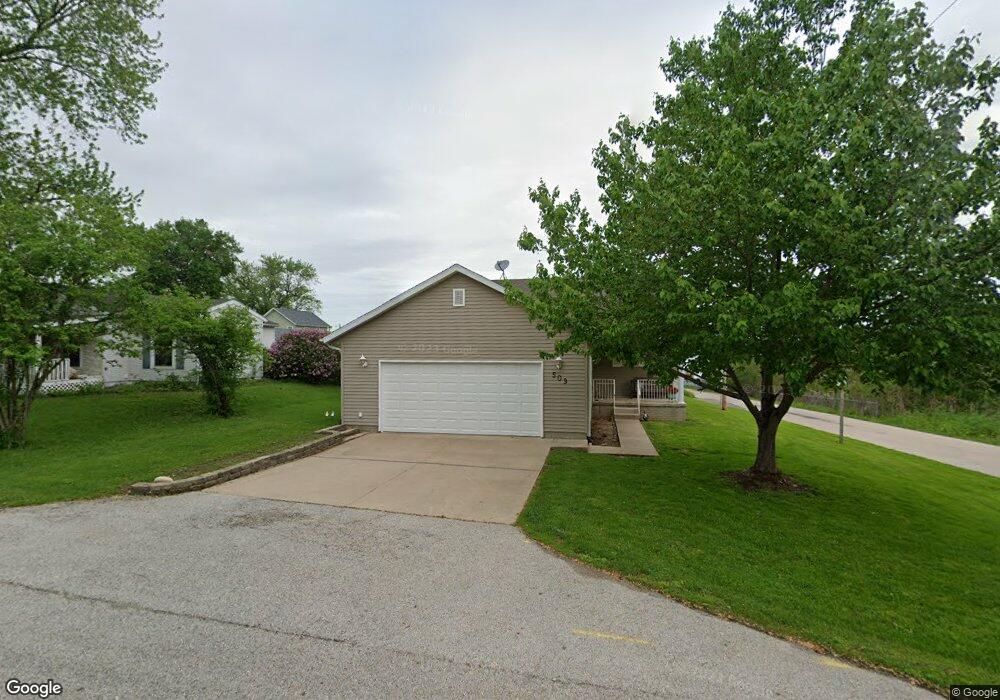
509 2nd Ave S Cordova, IL 61242
Estimated Value: $243,864 - $273,000
2
Beds
2
Baths
1,392
Sq Ft
$184/Sq Ft
Est. Value
About This Home
This home is located at 509 2nd Ave S, Cordova, IL 61242 and is currently estimated at $255,966, approximately $183 per square foot. 509 2nd Ave S is a home located in Rock Island County with nearby schools including Riverdale Elementary School, Riverdale Middle School, and Riverdale Senior High School.
Ownership History
Date
Name
Owned For
Owner Type
Purchase Details
Closed on
May 20, 2022
Sold by
Rtr Family Holdings Llc
Bought by
Wilkens Patricia
Current Estimated Value
Purchase Details
Closed on
Apr 9, 2020
Sold by
Leon W Russell Revocable Living Trust
Bought by
Rtr Family Holdings Llc
Purchase Details
Closed on
Mar 26, 2020
Sold by
Leon W Russell Revocable Living Trust
Bought by
Rtr Family Holdings Llc
Create a Home Valuation Report for This Property
The Home Valuation Report is an in-depth analysis detailing your home's value as well as a comparison with similar homes in the area
Home Values in the Area
Average Home Value in this Area
Purchase History
We collect this data history from publicly available records. To have your information removed, we recommend requesting removal directly through your county’s website.
| Date | Buyer | Sale Price | Title Company |
|---|---|---|---|
| Wilkens Patricia | $208,000 | Gomez Title | |
| Rtr Family Holdings Llc | -- | Schwiebert Law Pc | |
| Rtr Family Holdings Llc | -- | Schwiebert Law Pc |
Source: Public Records
Tax History
| Year | Tax Paid | Tax Assessment Tax Assessment Total Assessment is a certain percentage of the fair market value that is determined by local assessors to be the total taxable value of land and additions on the property. | Land | Improvement |
|---|---|---|---|---|
| 2024 | $4,384 | $79,294 | $8,567 | $70,727 |
| 2023 | $4,409 | $72,747 | $7,860 | $64,887 |
| 2022 | $4,256 | $66,494 | $7,496 | $58,998 |
| 2021 | $4,928 | $63,027 | $7,105 | $55,922 |
| 2020 | $4,358 | $62,096 | $7,000 | $55,096 |
| 2019 | $4,222 | $62,096 | $7,000 | $55,096 |
| 2018 | $4,222 | $61,626 | $5,516 | $56,110 |
| 2017 | $4,135 | $61,626 | $5,516 | $56,110 |
| 2016 | $4,077 | $60,775 | $5,440 | $55,335 |
| 2015 | $3,935 | $58,535 | $5,240 | $53,295 |
| 2014 | $778 | $57,387 | $5,137 | $52,250 |
| 2013 | $778 | $57,387 | $5,137 | $52,250 |
Source: Public Records
Map
Nearby Homes
Your Personal Tour Guide
Ask me questions while you tour the home.