509 3rd St Findlay, OH 45840
Estimated Value: $188,000 - $198,681
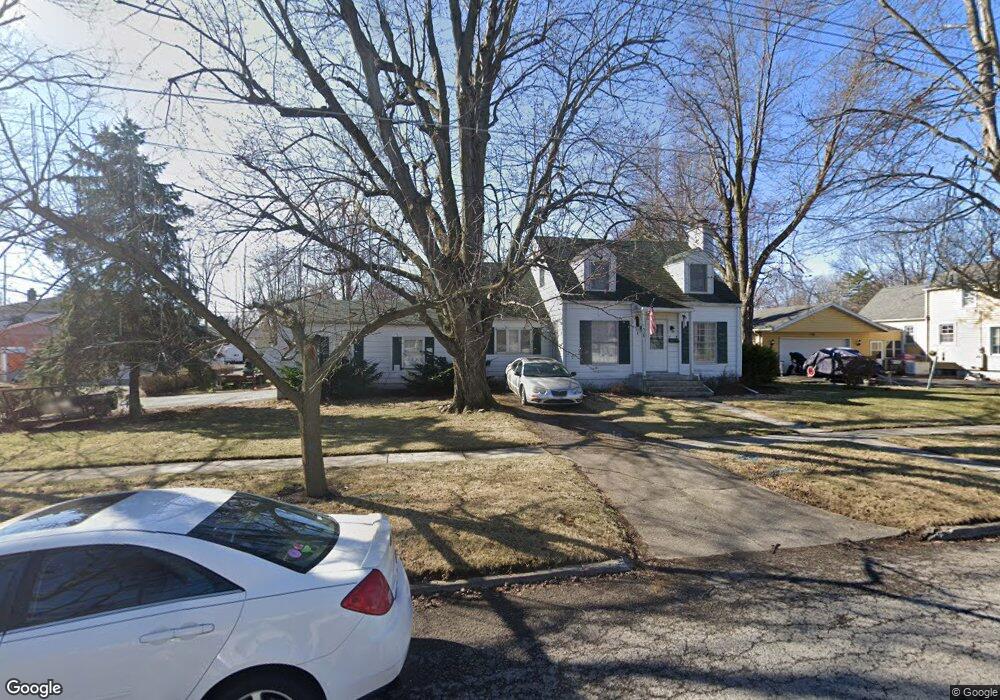
About This Home
This home is located at 509 3rd St, Findlay, OH 45840 and is currently estimated at $191,670, approximately $148 per square foot. 509 3rd St is a home located in Hancock County with nearby schools including Jefferson Elementary School, Chamberlin Hill Elementary School, and Donnell Middle School.
Ownership History
We collect this data history from publicly available records. To have your information removed, we recommend requesting removal directly through your county’s website.
Purchase Details
Home Financials for this Owner
Home Financials are based on the most recent Mortgage that was taken out on this home.Purchase Details
Home Financials for this Owner
Home Financials are based on the most recent Mortgage that was taken out on this home.Home Values in the Area
Average Home Value in this Area
Purchase History
We collect this data history from publicly available records. To have your information removed, we recommend requesting removal directly through your county’s website.
| Date | Buyer | Sale Price | Title Company |
|---|---|---|---|
| $100,000 | -- | ||
| $90,000 | -- |
Mortgage History
We collect this data history from publicly available records. To have your information removed, we recommend requesting removal directly through your county’s website.
| Date | Status | Borrower | Loan Amount |
|---|---|---|---|
| Closed | $84,000 | ||
| Previous Owner | $65,000 |
Tax History
We collect this data history from publicly available records. To have your information removed, we recommend requesting removal directly through your county’s website.
| Year | Tax Paid | Tax Assessment Tax Assessment Total Assessment is a certain percentage of the fair market value that is determined by local assessors to be the total taxable value of land and additions on the property. | Land | Improvement |
|---|---|---|---|---|
| 2025 | $1,958 | $63,880 | $8,940 | $54,940 |
| 2024 | $1,745 | $49,130 | $6,870 | $42,260 |
| 2023 | $1,748 | $49,130 | $6,870 | $42,260 |
| 2022 | $1,742 | $49,130 | $6,870 | $42,260 |
| 2021 | $1,567 | $38,490 | $6,860 | $31,630 |
| 2020 | $1,566 | $38,490 | $6,860 | $31,630 |
| 2019 | $1,535 | $38,490 | $6,860 | $31,630 |
| 2018 | $1,468 | $33,730 | $6,230 | $27,500 |
| 2017 | $733 | $33,730 | $6,230 | $27,500 |
| 2016 | $1,452 | $33,730 | $6,230 | $27,500 |
| 2015 | $1,301 | $29,760 | $6,230 | $23,530 |
| 2014 | $1,301 | $29,760 | $6,230 | $23,530 |
| 2012 | $1,293 | $29,300 | $5,770 | $23,530 |
Map
- 516 2nd St
- 1125 S Blanchard St
- 1231 S Blanchard St
- 127 1st St
- 119 Greenlawn Ave
- 1041 S Main St
- 1200 S Main St
- 853 Beech Ave
- 1730 Park St
- 825 Morse St
- 1809 Park St
- 319 Locust St
- 915 S West St
- 205 E Wallace St
- 423 Elm St
- 232 W Lima St
- 15586 Canadian Way
- 815 Liberty St
- 419 E Hobart Ave
- 136 E Hobart Ave
Ask me questions while you tour the home.