Estimated Value: $78,000 - $128,000
2
Beds
2
Baths
1,600
Sq Ft
$68/Sq Ft
Est. Value
About This Home
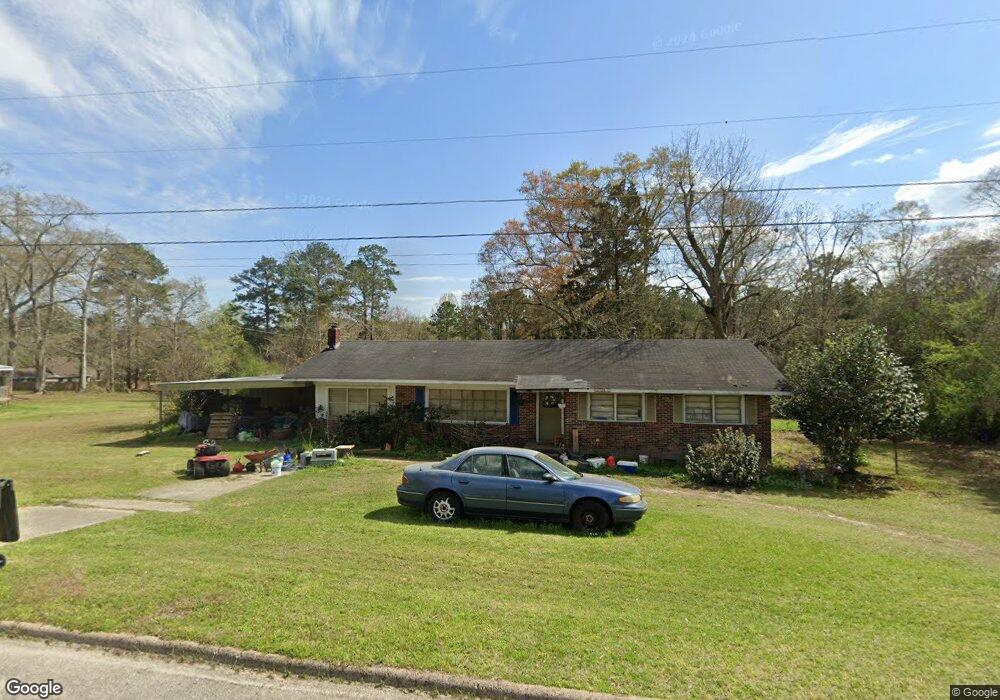
This home is located at 509 Arnold Ave, Opp, AL 36467 and is currently estimated at $108,864, approximately $68 per square foot. 509 Arnold Ave is a home located in Covington County with nearby schools including Opp Elementary School, Opp Middle School, and Opp High School.
Ownership History
Date
Name
Owned For
Owner Type
Purchase Details
Closed on
Apr 30, 2012
Sold by
Pittman Cecil Joshua and Cravey James M
Bought by
Stuart Andy B
Current Estimated Value
Home Financials for this Owner
Home Financials are based on the most recent Mortgage that was taken out on this home.
Original Mortgage
$46,685
Outstanding Balance
$32,104
Interest Rate
4.12%
Mortgage Type
FHA
Estimated Equity
$76,760
Purchase Details
Closed on
May 8, 2006
Sold by
Pittman Cecil J and Pittman Helen S
Bought by
Pittman Cecil Joshua and Cravey James M
Create a Home Valuation Report for This Property
The Home Valuation Report is an in-depth analysis detailing your home's value as well as a comparison with similar homes in the area
Home Values in the Area
Average Home Value in this Area
Purchase History
| Date | Buyer | Sale Price | Title Company |
|---|---|---|---|
| Stuart Andy B | -- | None Available | |
| Pittman Cecil Joshua | -- | None Available |
Source: Public Records
Mortgage History
| Date | Status | Borrower | Loan Amount |
|---|---|---|---|
| Open | Stuart Andy B | $46,685 |
Source: Public Records
Tax History
| Year | Tax Paid | Tax Assessment Tax Assessment Total Assessment is a certain percentage of the fair market value that is determined by local assessors to be the total taxable value of land and additions on the property. | Land | Improvement |
|---|---|---|---|---|
| 2025 | $500 | $28,000 | $1,560 | $26,440 |
| 2024 | $500 | $13,440 | $780 | $12,660 |
| 2023 | $477 | $11,568 | $680 | $10,888 |
| 2022 | $383 | $11,006 | $630 | $10,376 |
| 2021 | $309 | $9,120 | $630 | $8,490 |
| 2020 | $309 | $9,120 | $640 | $8,480 |
| 2019 | $334 | $9,760 | $640 | $9,120 |
| 2018 | $334 | $9,760 | $640 | $9,120 |
| 2017 | $317 | $0 | $0 | $0 |
| 2016 | $317 | $0 | $0 | $0 |
| 2015 | $317 | $0 | $0 | $0 |
| 2014 | $317 | $0 | $0 | $0 |
| 2013 | $288 | $8,595 | $632 | $7,963 |
Source: Public Records
Map
Nearby Homes
Your Personal Tour Guide
Ask me questions while you tour the home.