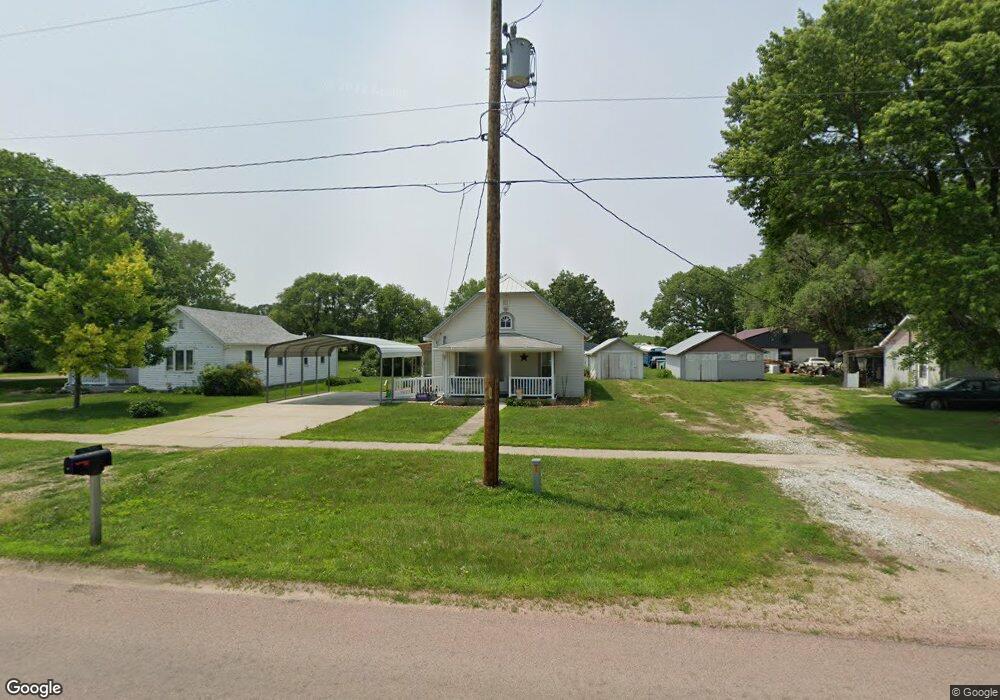
509 S 3rd St Cedar Rapids, NE 68627
Estimated Value: $64,000 - $175,000
2
Beds
1
Bath
892
Sq Ft
$128/Sq Ft
Est. Value
About This Home
This home is located at 509 S 3rd St, Cedar Rapids, NE 68627 and is currently estimated at $114,416, approximately $128 per square foot. 509 S 3rd St is a home located in Boone County.
Ownership History
Date
Name
Owned For
Owner Type
Purchase Details
Closed on
Aug 27, 2013
Sold by
Schilousky Cody R
Bought by
Voichahoske Steven F
Current Estimated Value
Create a Home Valuation Report for This Property
The Home Valuation Report is an in-depth analysis detailing your home's value as well as a comparison with similar homes in the area
Purchase History
| Date | Buyer | Sale Price | Title Company |
|---|---|---|---|
| Voichahoske Steven F | $20,000 | -- |
Source: Public Records
Tax History
| Year | Tax Paid | Tax Assessment Tax Assessment Total Assessment is a certain percentage of the fair market value that is determined by local assessors to be the total taxable value of land and additions on the property. | Land | Improvement |
|---|---|---|---|---|
| 2025 | -- | $52,960 | $9,480 | $43,480 |
| 2024 | -- | $49,505 | $6,025 | $43,480 |
| 2023 | $98 | $40,405 | $6,025 | $34,380 |
| 2022 | $115 | $36,200 | $6,025 | $30,175 |
| 2021 | $438 | $34,275 | $6,025 | $28,250 |
| 2020 | $398 | $30,595 | $6,025 | $24,570 |
| 2019 | $389 | $30,595 | $6,025 | $24,570 |
| 2018 | $347 | $27,725 | $3,155 | $24,570 |
| 2017 | $323 | $27,725 | $3,155 | $24,570 |
| 2016 | $255 | $23,600 | $3,155 | $20,445 |
| 2015 | $216 | $21,925 | $3,155 | $18,770 |
| 2012 | $249 | $14,695 | $3,155 | $11,540 |
Source: Public Records
Map
Nearby Homes
Your Personal Tour Guide
Ask me questions while you tour the home.