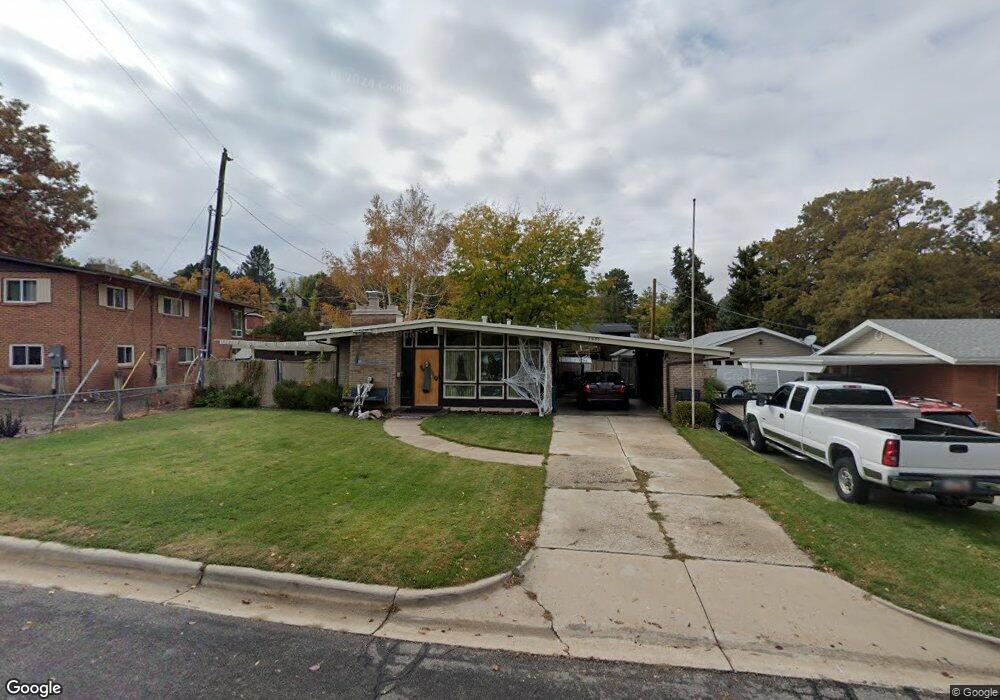
5091 S 785 E Ogden, UT 84403
South Ogden AreaEstimated Value: $403,277 - $438,000
About This Home
This home is located at 5091 S 785 E, Ogden, UT 84403 and is currently estimated at $422,819, approximately $361 per square foot. 5091 S 785 E is a home located in Weber County with nearby schools including Uintah School, South Ogden Junior High School, and Bonneville High School.
Ownership History
We collect this data history from publicly available records. To have your information removed, we recommend requesting removal directly through your county’s website.
Purchase Details
Home Financials for this Owner
Home Financials are based on the most recent Mortgage that was taken out on this home.Home Values in the Area
Average Home Value in this Area
Purchase History
We collect this data history from publicly available records. To have your information removed, we recommend requesting removal directly through your county’s website.
| Date | Buyer | Sale Price | Title Company |
|---|---|---|---|
| -- | Inwest Title |
Mortgage History
We collect this data history from publicly available records. To have your information removed, we recommend requesting removal directly through your county’s website.
| Date | Status | Borrower | Loan Amount |
|---|---|---|---|
| Open | $161,561 | ||
| Closed | $164,086 | ||
| Closed | $165,251 | ||
| Closed | $171,830 | ||
| Previous Owner | $165,000 |
Tax History
We collect this data history from publicly available records. To have your information removed, we recommend requesting removal directly through your county’s website.
| Year | Tax Paid | Tax Assessment Tax Assessment Total Assessment is a certain percentage of the fair market value that is determined by local assessors to be the total taxable value of land and additions on the property. | Land | Improvement |
|---|---|---|---|---|
| 2025 | $2,537 | $347,194 | $143,504 | $203,690 |
| 2024 | $2,509 | $193,599 | $78,927 | $114,672 |
| 2023 | $2,314 | $178,200 | $79,841 | $98,359 |
| 2022 | $2,115 | $166,650 | $60,893 | $105,757 |
| 2021 | $1,812 | $237,000 | $68,522 | $168,478 |
| 2020 | $1,703 | $207,000 | $57,101 | $149,899 |
| 2019 | $1,622 | $187,000 | $42,271 | $144,729 |
| 2018 | $1,481 | $160,000 | $42,271 | $117,729 |
| 2017 | $274 | $139,000 | $40,362 | $98,638 |
| 2016 | $268 | $70,294 | $27,130 | $43,164 |
| 2015 | $261 | $66,091 | $27,130 | $38,961 |
| 2014 | $246 | $66,091 | $27,130 | $38,961 |
Map
- 730 Oak Dr
- 889 Ben Lomond Ave
- 571 Ben Lomond Ave
- 4872 Burch Creek Dr
- 4863 Glasmann Way
- 4723 Madison Ave
- 1062 E 5050 S
- 5401 S 825 E
- 1039 E 4975 S
- 4835 Burch Creek Dr
- 5371 S 600 E
- 4825 Burch Creek Dr
- 5424 S 850 E
- 4792 Glasmann Way
- 4675 Jefferson Ave
- 4893 S 1075 E
- 5455 S 925 E
- 796 Nancy Dr
- 5263 Daybreak Dr
- 510 E 5400 S Unit 42
Ask me questions while you tour the home.