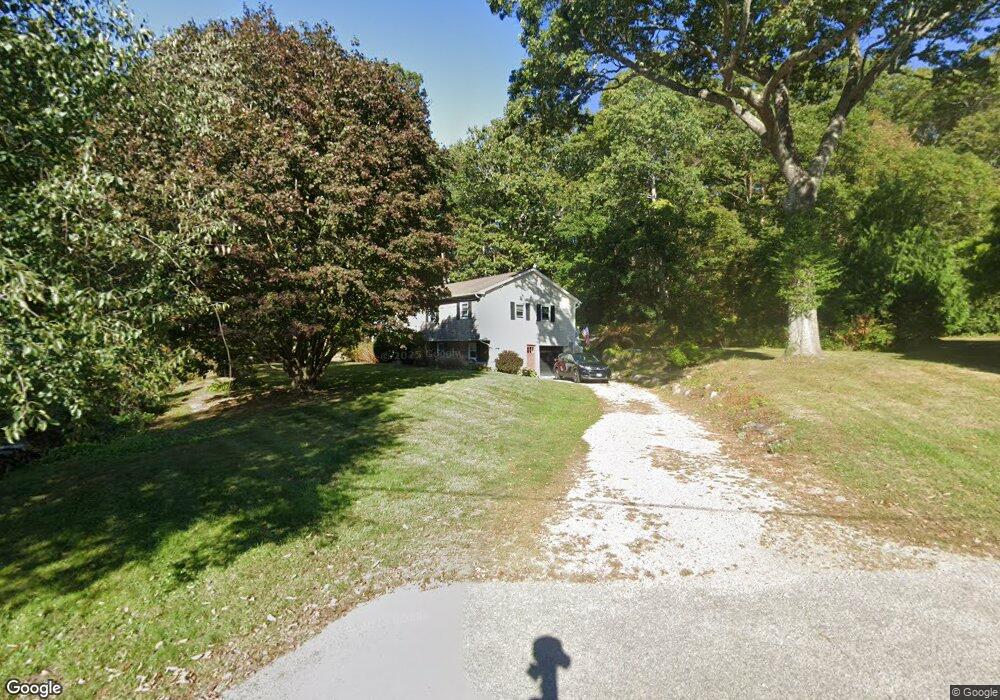
51 E Charles St Charlestown, RI 02813
Estimated Value: $527,000 - $614,037
3
Beds
3
Baths
1,248
Sq Ft
$447/Sq Ft
Est. Value
About This Home
This home is located at 51 E Charles St, Charlestown, RI 02813 and is currently estimated at $557,509, approximately $446 per square foot. 51 E Charles St is a home located in Washington County with nearby schools including Chariho Regional Middle School and Chariho High School.
Ownership History
Date
Name
Owned For
Owner Type
Purchase Details
Closed on
Oct 29, 2020
Sold by
Hawley-Mary Beth G
Bought by
Sloan Christopher P
Current Estimated Value
Home Financials for this Owner
Home Financials are based on the most recent Mortgage that was taken out on this home.
Original Mortgage
$247,900
Outstanding Balance
$218,065
Interest Rate
2.8%
Mortgage Type
New Conventional
Estimated Equity
$339,444
Purchase Details
Closed on
Sep 4, 2015
Sold by
Sloan Wanda R
Bought by
Sloan Christopher P and Hawley Mary B
Create a Home Valuation Report for This Property
The Home Valuation Report is an in-depth analysis detailing your home's value as well as a comparison with similar homes in the area
Home Values in the Area
Average Home Value in this Area
Purchase History
| Date | Buyer | Sale Price | Title Company |
|---|---|---|---|
| Sloan Christopher P | -- | None Available | |
| Sloan Christopher P | -- | -- |
Source: Public Records
Mortgage History
| Date | Status | Borrower | Loan Amount |
|---|---|---|---|
| Open | Sloan Christopher P | $247,900 |
Source: Public Records
Tax History
| Year | Tax Paid | Tax Assessment Tax Assessment Total Assessment is a certain percentage of the fair market value that is determined by local assessors to be the total taxable value of land and additions on the property. | Land | Improvement |
|---|---|---|---|---|
| 2025 | $2,486 | $419,300 | $144,200 | $275,100 |
| 2024 | $2,424 | $419,300 | $144,200 | $275,100 |
| 2023 | $2,407 | $419,300 | $144,200 | $275,100 |
| 2022 | $2,690 | $329,200 | $103,000 | $226,200 |
| 2021 | $2,693 | $329,200 | $103,000 | $226,200 |
| 2020 | $2,709 | $329,200 | $103,000 | $226,200 |
| 2019 | $2,450 | $265,400 | $89,000 | $176,400 |
| 2018 | $2,558 | $265,400 | $89,000 | $176,400 |
| 2017 | $2,545 | $265,400 | $89,000 | $176,400 |
| 2016 | $2,495 | $244,400 | $80,900 | $163,500 |
| 2015 | $2,471 | $244,400 | $80,900 | $163,500 |
| 2014 | $2,420 | $244,400 | $80,900 | $163,500 |
Source: Public Records
Map
Nearby Homes
- 18 Catalpa Ct
- 4459 Old Post Rd
- 111 King Tom Dr
- 25 Maritime Dr Unit 25C
- 72 General Stanton Ln
- 22-38 Lewis Trail
- 4772 Rd
- 4772 Rd
- 77 Pond Shore Dr
- 89 Narrow Ln
- 45 Elizabeth Cooper Dr
- 120 Narrow Ln
- 4772 Old Post #18 Rd
- 02 Crosswinds Dr
- 4772 Rd
- 350 Narrow Ln
- 4772 Old Post #19 Rd
- 4772 Rd
- 03 Crosswinds Dr
- 0 Crosswinds Dr Unit 1402536
Your Personal Tour Guide
Ask me questions while you tour the home.