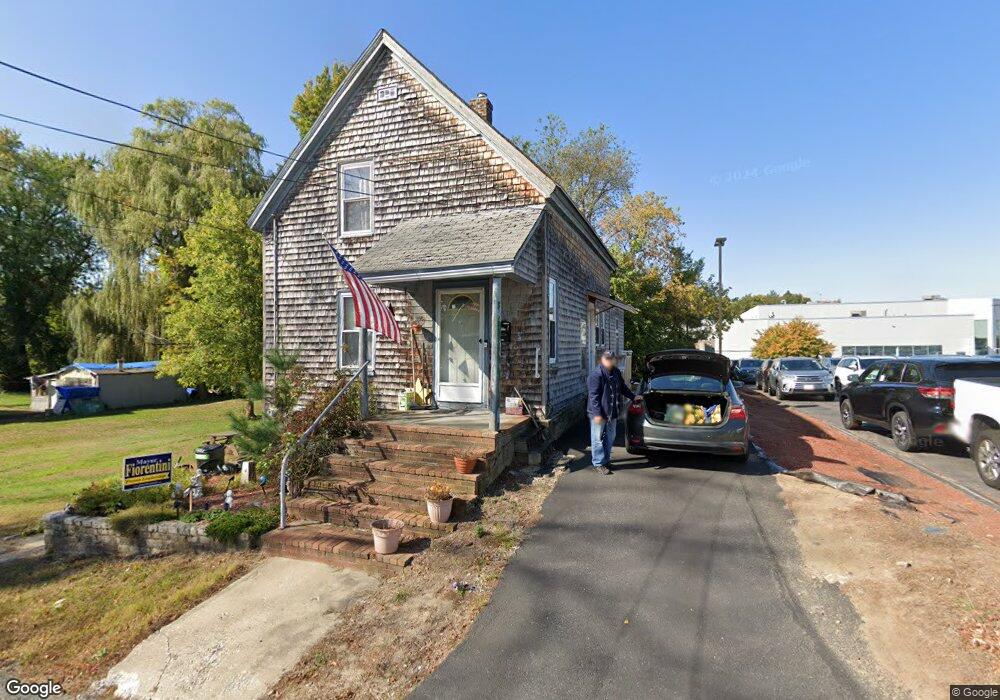
51 Maxwell St Haverhill, MA 01832
Mount Washington NeighborhoodEstimated Value: $441,000 - $541,000
About This Home
This home is located at 51 Maxwell St, Haverhill, MA 01832 and is currently estimated at $490,802, approximately $368 per square foot. 51 Maxwell St is a home located in Essex County with nearby schools including Greenleaf Academy, Bradford Elementary School, and Haverhill High School.
Ownership History
We collect this data history from publicly available records. To have your information removed, we recommend requesting removal directly through your county’s website.
Purchase Details
Purchase Details
Purchase Details
Purchase Details
Home Values in the Area
Average Home Value in this Area
Purchase History
We collect this data history from publicly available records. To have your information removed, we recommend requesting removal directly through your county’s website.
| Date | Buyer | Sale Price | Title Company |
|---|---|---|---|
| -- | -- | ||
| -- | -- | ||
| -- | -- | ||
| -- | None Available | ||
| -- | None Available | ||
| -- | -- |
Mortgage History
We collect this data history from publicly available records. To have your information removed, we recommend requesting removal directly through your county’s website.
| Date | Status | Borrower | Loan Amount |
|---|---|---|---|
| Closed | $7,500 |
Tax History
We collect this data history from publicly available records. To have your information removed, we recommend requesting removal directly through your county’s website.
| Year | Tax Paid | Tax Assessment Tax Assessment Total Assessment is a certain percentage of the fair market value that is determined by local assessors to be the total taxable value of land and additions on the property. | Land | Improvement |
|---|---|---|---|---|
| 2025 | $4,017 | $375,100 | $162,700 | $212,400 |
| 2024 | $3,848 | $361,700 | $159,400 | $202,300 |
| 2023 | $3,822 | $342,800 | $159,400 | $183,400 |
| 2022 | $3,769 | $296,300 | $151,300 | $145,000 |
| 2021 | $3,509 | $261,100 | $135,000 | $126,100 |
| 2020 | $3,405 | $250,400 | $126,900 | $123,500 |
| 2019 | $3,266 | $234,100 | $110,600 | $123,500 |
| 2018 | $3,120 | $218,800 | $104,100 | $114,700 |
| 2017 | $3,082 | $205,600 | $100,900 | $104,700 |
| 2016 | $2,769 | $180,300 | $78,100 | $102,200 |
| 2015 | $2,768 | $180,300 | $78,100 | $102,200 |
Map
- 80/88 River St
- 207 Wilson St
- 204 Wilson St Unit 204
- 479 Washington St
- 477 Washington St Unit 477
- 4 Scarlet Cir
- 454 Washington St
- 38 Idora Ave
- 40 Idora Ave
- 2 Hillside Ave
- 7 Overlook Ave
- 16 S Merrill St
- 4 Myles Standish Dr Unit 5
- 219 River St
- 8 Myles Standish Dr Unit 2
- 120 High St
- 310 Washington St
- 301 Washington St
- 37 Warrenton Rd
- 2 Avon Place
Ask me questions while you tour the home.