51 Orient St Warwick, RI 02886
Cowesett NeighborhoodEstimated Value: $500,000 - $541,947
About This Home
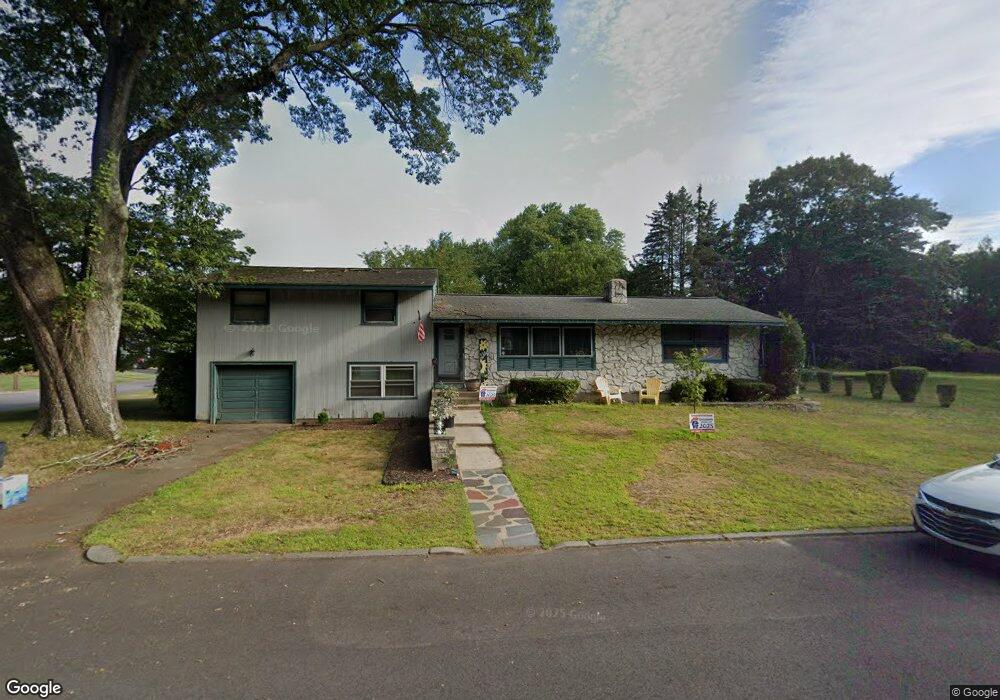
This home is located at 51 Orient St, Warwick, RI 02886 and is currently estimated at $525,487, approximately $342 per square foot. 51 Orient St is a home located in Kent County with nearby schools including St Rose Of Lima School and Eleanor Briggs School.
Ownership History
We collect this data history from publicly available records. To have your information removed, we recommend requesting removal directly through your county’s website.
Purchase Details
Home Financials for this Owner
Home Financials are based on the most recent Mortgage that was taken out on this home.Home Values in the Area
Average Home Value in this Area
Purchase History
We collect this data history from publicly available records. To have your information removed, we recommend requesting removal directly through your county’s website.
| Date | Buyer | Sale Price | Title Company |
|---|---|---|---|
| $200,000 | None Available | ||
| $200,000 | None Available |
Mortgage History
We collect this data history from publicly available records. To have your information removed, we recommend requesting removal directly through your county’s website.
| Date | Status | Borrower | Loan Amount |
|---|---|---|---|
| Open | $190,000 | ||
| Closed | $190,000 |
Tax History
We collect this data history from publicly available records. To have your information removed, we recommend requesting removal directly through your county’s website.
| Year | Tax Paid | Tax Assessment Tax Assessment Total Assessment is a certain percentage of the fair market value that is determined by local assessors to be the total taxable value of land and additions on the property. | Land | Improvement |
|---|---|---|---|---|
| 2025 | $6,074 | $478,300 | $159,300 | $319,000 |
| 2024 | $6,316 | $436,500 | $134,000 | $302,500 |
| 2023 | $6,194 | $436,500 | $134,000 | $302,500 |
| 2022 | $5,610 | $299,500 | $81,900 | $217,600 |
| 2021 | $5,610 | $299,500 | $81,900 | $217,600 |
| 2020 | $5,610 | $299,500 | $81,900 | $217,600 |
| 2019 | $5,610 | $299,500 | $81,900 | $217,600 |
| 2018 | $5,391 | $259,200 | $81,900 | $177,300 |
| 2017 | $5,246 | $259,200 | $81,900 | $177,300 |
| 2016 | $5,246 | $259,200 | $81,900 | $177,300 |
| 2015 | $4,393 | $211,700 | $74,100 | $137,600 |
| 2014 | $4,247 | $211,700 | $74,100 | $137,600 |
| 2013 | $4,190 | $211,700 | $74,100 | $137,600 |
Map
- 162 Larchmont Rd
- 117 Larchmont Rd
- 155 Birkshire Dr
- 36 Edmond Dr
- 7 Friar Tuck Rd
- 119 Gilbert St
- 69 Douglas Rd
- 58 Rip Van Winkle Cir
- 1 Cassidy
- 193 Sleepy Hollow Farm Rd
- 41 Bruce Ln
- 135 Red Chimney Dr
- 322 Sleepy Hollow Farm Rd
- 187 Love Ln
- 205 Baldwin Rd
- 55 Blue Hill Dr
- 0 Arnolds Neck Dr
- 190 Arnolds Neck Dr
- 121 Prospect St
- 139 Lancaster Ave
Ask me questions while you tour the home.