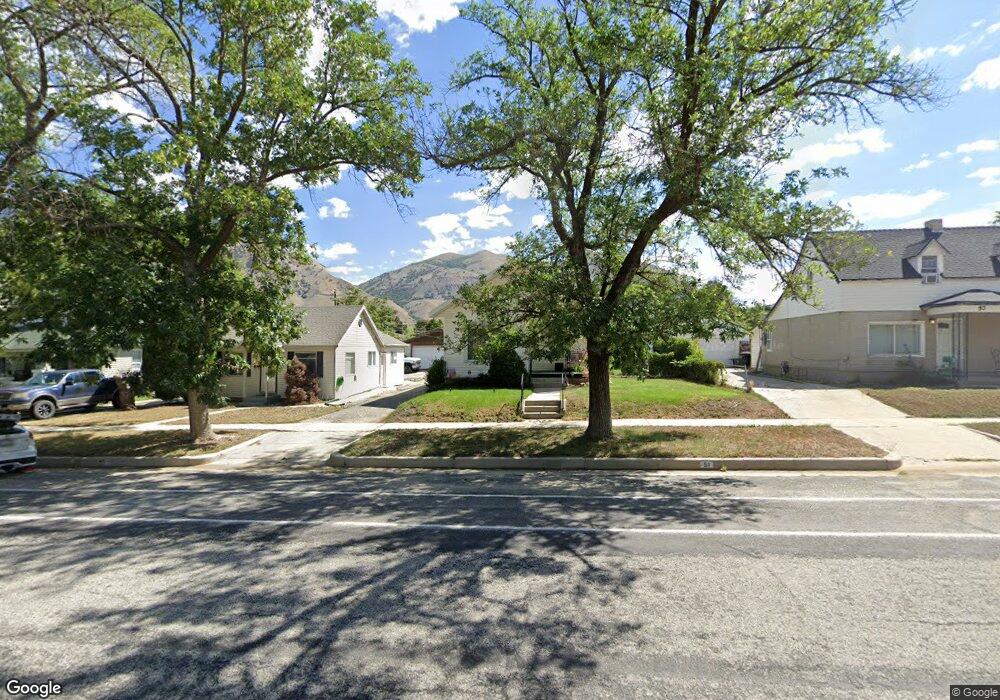
51 S 200 E Brigham City, UT 84302
Estimated Value: $299,000 - $342,000
2
Beds
1
Bath
1,300
Sq Ft
$241/Sq Ft
Est. Value
About This Home
This home is located at 51 S 200 E, Brigham City, UT 84302 and is currently estimated at $313,902, approximately $241 per square foot. 51 S 200 E is a home located in Box Elder County with nearby schools including Golden Spike Elementary, Box Elder Middle School, and Adele C. Young Intermediate School.
Ownership History
Date
Name
Owned For
Owner Type
Purchase Details
Closed on
Jun 12, 2013
Sold by
Anderson Neal D
Bought by
Brown Ashley A
Current Estimated Value
Home Financials for this Owner
Home Financials are based on the most recent Mortgage that was taken out on this home.
Original Mortgage
$93,877
Outstanding Balance
$66,749
Interest Rate
3.48%
Mortgage Type
New Conventional
Estimated Equity
$247,153
Purchase Details
Closed on
Jun 27, 2011
Sold by
Vess Steven Brent and Bunnell Deeann Hess
Bought by
Anderson Neal D
Home Financials for this Owner
Home Financials are based on the most recent Mortgage that was taken out on this home.
Original Mortgage
$84,974
Interest Rate
4.54%
Mortgage Type
New Conventional
Create a Home Valuation Report for This Property
The Home Valuation Report is an in-depth analysis detailing your home's value as well as a comparison with similar homes in the area
Purchase History
We collect this data history from publicly available records. To have your information removed, we recommend requesting removal directly through your county’s website.
| Date | Buyer | Sale Price | Title Company |
|---|---|---|---|
| Brown Ashley A | -- | None Available | |
| Anderson Neal D | -- | Us Title |
Source: Public Records
Mortgage History
We collect this data history from publicly available records. To have your information removed, we recommend requesting removal directly through your county’s website.
| Date | Status | Borrower | Loan Amount |
|---|---|---|---|
| Open | Brown Ashley A | $93,877 | |
| Previous Owner | Anderson Neal D | $84,974 |
Source: Public Records
Tax History
| Year | Tax Paid | Tax Assessment Tax Assessment Total Assessment is a certain percentage of the fair market value that is determined by local assessors to be the total taxable value of land and additions on the property. | Land | Improvement |
|---|---|---|---|---|
| 2025 | $1,417 | $243,599 | $104,750 | $138,849 |
| 2024 | $1,231 | $236,984 | $99,750 | $137,234 |
| 2023 | $1,233 | $243,123 | $94,750 | $148,373 |
| 2022 | $1,157 | $116,601 | $21,863 | $94,738 |
| 2021 | $925 | $139,414 | $39,750 | $99,664 |
| 2020 | $858 | $139,414 | $39,750 | $99,664 |
| 2019 | $814 | $70,372 | $21,863 | $48,509 |
| 2018 | $745 | $64,045 | $21,863 | $42,182 |
| 2017 | $639 | $95,065 | $16,500 | $65,065 |
| 2016 | $672 | $50,582 | $16,500 | $34,082 |
| 2015 | $635 | $47,484 | $16,500 | $30,984 |
| 2014 | $635 | $46,008 | $16,500 | $29,508 |
| 2013 | -- | $46,008 | $16,500 | $29,508 |
Source: Public Records
Map
Nearby Homes
Your Personal Tour Guide
Ask me questions while you tour the home.