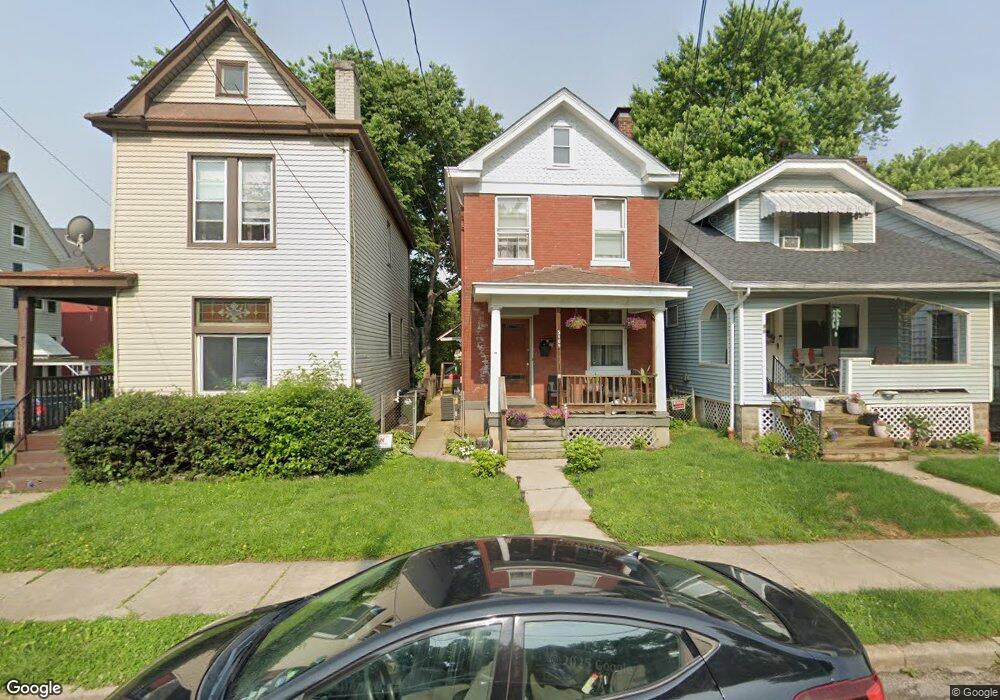
5109 Silver St Cincinnati, OH 45212
Norwood AreaEstimated Value: $190,000 - $225,996
About This Home
This home is located at 5109 Silver St, Cincinnati, OH 45212 and is currently estimated at $205,749, approximately $116 per square foot. 5109 Silver St is a home located in Hamilton County with nearby schools including Norwood High School, Cornerstone Christian Academy, and Immaculate Conception Academy.
Ownership History
We collect this data history from publicly available records. To have your information removed, we recommend requesting removal directly through your county’s website.
Purchase Details
Home Financials for this Owner
Home Financials are based on the most recent Mortgage that was taken out on this home.Purchase Details
Home Values in the Area
Average Home Value in this Area
Purchase History
We collect this data history from publicly available records. To have your information removed, we recommend requesting removal directly through your county’s website.
| Date | Buyer | Sale Price | Title Company |
|---|---|---|---|
| $53,000 | -- | ||
| -- | -- |
Mortgage History
We collect this data history from publicly available records. To have your information removed, we recommend requesting removal directly through your county’s website.
| Date | Status | Borrower | Loan Amount |
|---|---|---|---|
| Previous Owner | $47,700 |
Tax History
We collect this data history from publicly available records. To have your information removed, we recommend requesting removal directly through your county’s website.
| Year | Tax Paid | Tax Assessment Tax Assessment Total Assessment is a certain percentage of the fair market value that is determined by local assessors to be the total taxable value of land and additions on the property. | Land | Improvement |
|---|---|---|---|---|
| 2025 | $2,659 | $49,872 | $7,119 | $42,753 |
| 2023 | $2,674 | $49,872 | $7,119 | $42,753 |
| 2022 | $1,654 | $25,936 | $5,394 | $20,542 |
| 2021 | $1,636 | $25,936 | $5,394 | $20,542 |
| 2020 | $1,600 | $25,936 | $5,394 | $20,542 |
| 2019 | $1,527 | $22,750 | $4,732 | $18,018 |
| 2018 | $1,528 | $22,750 | $4,732 | $18,018 |
| 2017 | $1,844 | $28,704 | $4,732 | $23,972 |
| 2016 | $1,172 | $17,396 | $4,449 | $12,947 |
| 2015 | $1,033 | $17,396 | $4,449 | $12,947 |
| 2014 | $1,405 | $23,738 | $4,449 | $19,289 |
| 2013 | $1,478 | $25,253 | $4,732 | $20,521 |
Map
- 5134 Silver St
- 2102 Ross Ave
- 5145 Carthage Ave
- 5121 Globe Ave
- 5123 Globe Ave
- 5131 Globe Ave
- 5229 Globe Ave
- 5207 Hunter Ave
- 2130 Feldman Ave
- 5234 Hunter Ave
- 2144 Feldman Ave
- 2217 Feldman Ave
- 5203 Rolston Ave
- 5315 Carthage Ave
- 2260 Buxton Ave
- 5206 Montgomery Rd
- 5119 Warren Ave
- 5210 Montgomery Rd
- 2241 Feldman Ave
- 5258 Hunter Ave
- 5116 Silver St
- 5112 Silver St
- 5110 Silver St
- 5120 Silver St
- 5108 Silver St
- 5108 Silver St Unit 2
- 5122 Silver St
- 5106 Silver St
- 5124 Silver St
- 5121 Carthage Ave
- 5119 Carthage Ave
- 2124 Ross Ave
- 5117 Carthage Ave
- 5126 Silver St
- 5123 Carthage Ave
- 2126 Ross Ave
- 5115 Carthage Ave
- 2122 Ross Ave
- 5125 Carthage Ave
- 2120 Ross Ave
Ask me questions while you tour the home.