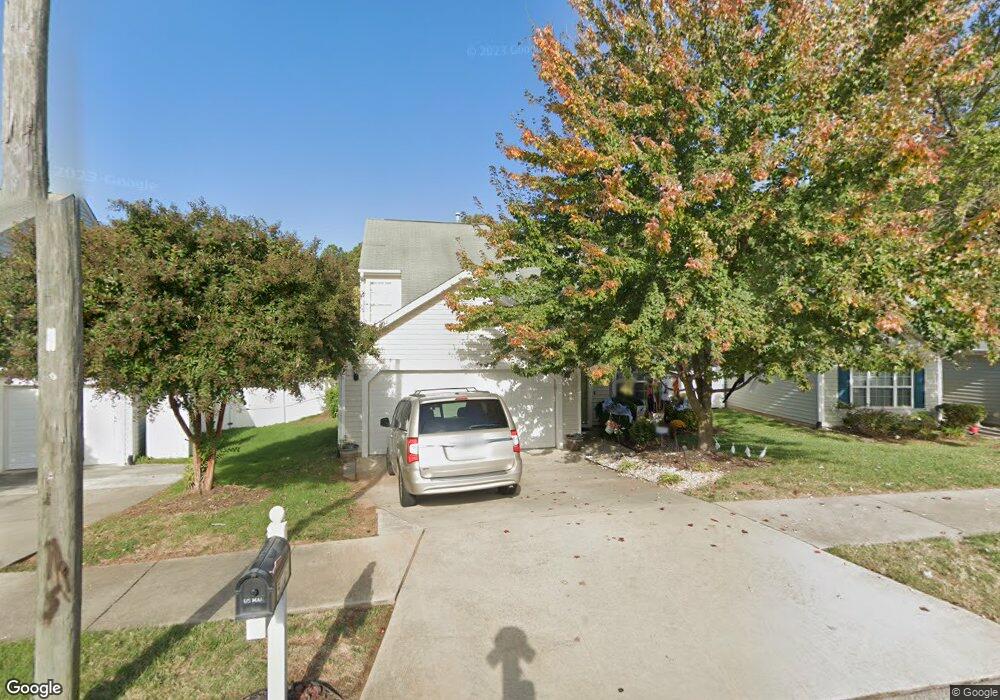
5109 Suda Dr Durham, NC 27703
South Durham NeighborhoodEstimated Value: $372,000 - $382,689
3
Beds
3
Baths
1,731
Sq Ft
$218/Sq Ft
Est. Value
About This Home
This home is located at 5109 Suda Dr, Durham, NC 27703 and is currently estimated at $376,922, approximately $217 per square foot. 5109 Suda Dr is a home located in Durham County with nearby schools including Bethesda Elementary School, John W Neal Middle School, and Southern School of Energy & Sustainability.
Ownership History
Date
Name
Owned For
Owner Type
Purchase Details
Closed on
Jul 14, 2014
Sold by
Mann David D and Mann Diana
Bought by
Crabtree Bobby Lee and Crabtree Amy Beth
Current Estimated Value
Home Financials for this Owner
Home Financials are based on the most recent Mortgage that was taken out on this home.
Original Mortgage
$164,900
Outstanding Balance
$127,186
Interest Rate
4.5%
Mortgage Type
Adjustable Rate Mortgage/ARM
Estimated Equity
$249,736
Purchase Details
Closed on
Jun 1, 2004
Sold by
Anderson Homes Inc
Bought by
Mann David D
Home Financials for this Owner
Home Financials are based on the most recent Mortgage that was taken out on this home.
Original Mortgage
$123,280
Interest Rate
5.25%
Mortgage Type
Purchase Money Mortgage
Create a Home Valuation Report for This Property
The Home Valuation Report is an in-depth analysis detailing your home's value as well as a comparison with similar homes in the area
Home Values in the Area
Average Home Value in this Area
Purchase History
We collect this data history from publicly available records. To have your information removed, we recommend requesting removal directly through your county’s website.
| Date | Buyer | Sale Price | Title Company |
|---|---|---|---|
| Crabtree Bobby Lee | $165,000 | None Available | |
| Mann David D | $154,500 | -- |
Source: Public Records
Mortgage History
We collect this data history from publicly available records. To have your information removed, we recommend requesting removal directly through your county’s website.
| Date | Status | Borrower | Loan Amount |
|---|---|---|---|
| Open | Crabtree Bobby Lee | $164,900 | |
| Previous Owner | Mann David D | $123,280 | |
| Closed | Mann David D | $23,115 |
Source: Public Records
Tax History
| Year | Tax Paid | Tax Assessment Tax Assessment Total Assessment is a certain percentage of the fair market value that is determined by local assessors to be the total taxable value of land and additions on the property. | Land | Improvement |
|---|---|---|---|---|
| 2025 | $3,810 | $384,308 | $118,650 | $265,658 |
| 2024 | $3,094 | $221,827 | $42,450 | $179,377 |
| 2023 | $2,906 | $221,827 | $42,450 | $179,377 |
| 2022 | $2,839 | $221,827 | $42,450 | $179,377 |
| 2021 | $2,826 | $221,827 | $42,450 | $179,377 |
| 2020 | $2,759 | $221,827 | $42,450 | $179,377 |
| 2019 | $2,759 | $221,827 | $42,450 | $179,377 |
| 2018 | $2,415 | $177,996 | $28,300 | $149,696 |
| 2017 | $2,397 | $177,996 | $28,300 | $149,696 |
| 2016 | $2,316 | $177,996 | $28,300 | $149,696 |
| 2015 | $2,395 | $172,999 | $35,251 | $137,748 |
| 2014 | $2,395 | $172,999 | $35,251 | $137,748 |
Source: Public Records
Map
Nearby Homes
- 5108 Suda Dr
- 5101 Suda Dr
- 4 Gandhi Dr
- 1907 Raj Dr
- 1812 Shiva Ct
- 12 Sameer Ct
- 237 Westgrove Ct
- 5216 Dilbagh Dr
- 145 Torrey Heights Ln
- 2709 Hidden Hollow Dr
- 1118 Neighborly Way
- 1001 Epiphany Rd
- 1005 Epiphany Rd
- 102 Kingsley Woods Dr
- 3310 Forest Grove Ct
- 402 Brier Summit Place
- 1108 Felman Rd
- 1021 Brightskies St
- 3508 Appling Way
- 126 Pelsett St
Your Personal Tour Guide
Ask me questions while you tour the home.