511 Bridge St Bridgewater, MA 02324
Estimated Value: $460,000 - $525,000
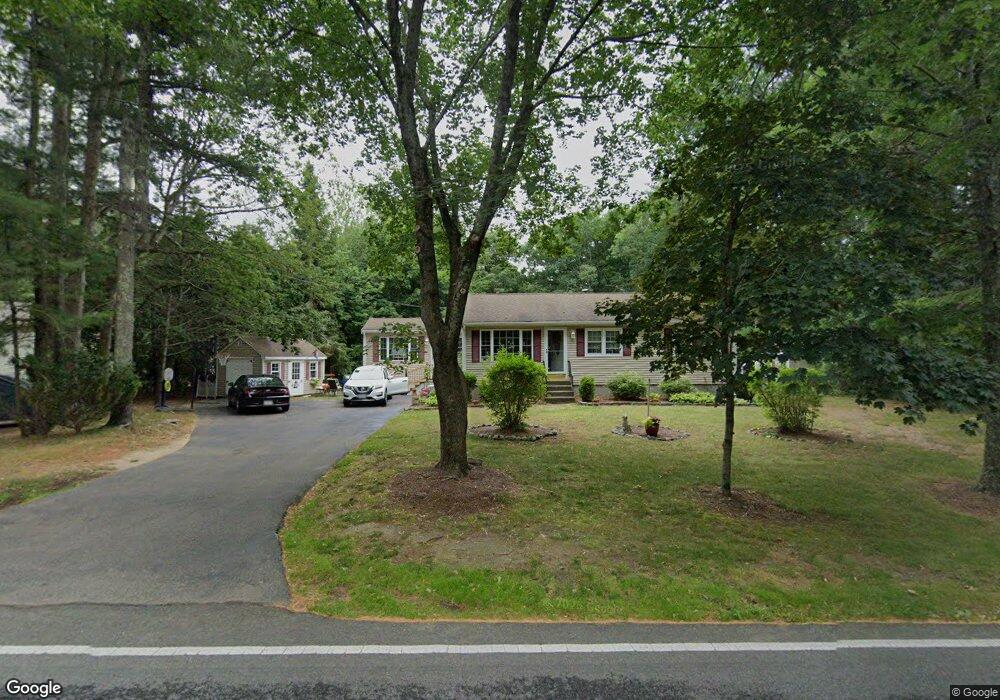
About This Home
This home is located at 511 Bridge St, Bridgewater, MA 02324 and is currently estimated at $481,504, approximately $501 per square foot. 511 Bridge St is a home located in Plymouth County with nearby schools including Mitchell Elementary School, Williams Intermediate School, and Bridgewater Middle School.
Ownership History
We collect this data history from publicly available records. To have your information removed, we recommend requesting removal directly through your county’s website.
Purchase Details
Purchase Details
Home Values in the Area
Average Home Value in this Area
Purchase History
We collect this data history from publicly available records. To have your information removed, we recommend requesting removal directly through your county’s website.
| Date | Buyer | Sale Price | Title Company |
|---|---|---|---|
| -- | None Available | ||
| $40,600 | -- |
Mortgage History
We collect this data history from publicly available records. To have your information removed, we recommend requesting removal directly through your county’s website.
| Date | Status | Borrower | Loan Amount |
|---|---|---|---|
| Previous Owner | $100,000 | ||
| Previous Owner | $75,000 |
Tax History
We collect this data history from publicly available records. To have your information removed, we recommend requesting removal directly through your county’s website.
| Year | Tax Paid | Tax Assessment Tax Assessment Total Assessment is a certain percentage of the fair market value that is determined by local assessors to be the total taxable value of land and additions on the property. | Land | Improvement |
|---|---|---|---|---|
| 2025 | $5,170 | $437,000 | $188,800 | $248,200 |
| 2024 | $5,061 | $416,900 | $179,800 | $237,100 |
| 2023 | $5,006 | $389,900 | $168,000 | $221,900 |
| 2022 | $4,902 | $342,300 | $147,400 | $194,900 |
| 2021 | $4,458 | $307,900 | $131,600 | $176,300 |
| 2020 | $4,363 | $296,200 | $126,500 | $169,700 |
| 2019 | $4,277 | $288,400 | $126,500 | $161,900 |
| 2018 | $3,890 | $256,100 | $116,700 | $139,400 |
| 2017 | $3,792 | $242,900 | $116,700 | $126,200 |
| 2016 | $3,636 | $234,000 | $114,500 | $119,500 |
| 2015 | $3,660 | $225,400 | $111,100 | $114,300 |
| 2014 | $3,486 | $214,500 | $102,100 | $112,400 |
Map
- 43 Fieldstone Cir
- 391 W Pond St
- 2030 Plymouth St
- 1126 Plymouth St
- 30 Fieldcrest Dr
- 23 Quarry Stone Dr
- 55 Hillside Ave
- 53 Country Dr
- 0 River Rd Extension
- 5 Rock Meadow Dr
- 12 Rainbow Cir
- 2 Ridgewood Cir
- 89 Trailwood Dr
- 4 Trailwood Dr
- Lot 1 Mill St
- 360 Bridge St
- 1617 Plymouth St Unit 1
- 1617 Plymouth St
- 115 Arrowhead Dr
- 5 Tuckoosa Cir
Ask me questions while you tour the home.