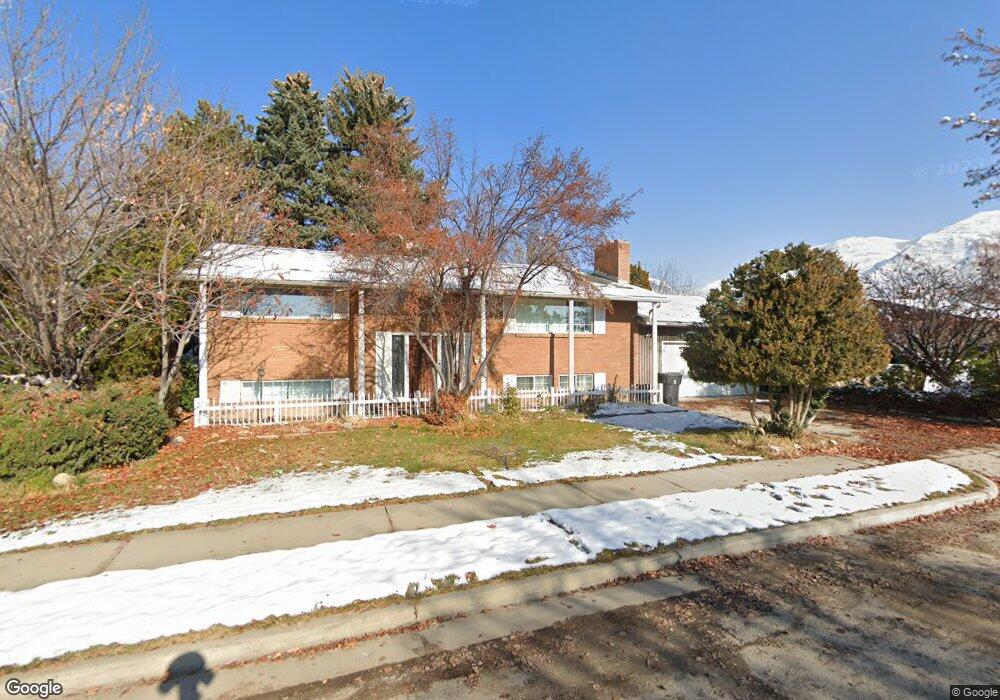
511 E 380 N American Fork, UT 84003
Estimated Value: $481,000 - $524,636
4
Beds
2
Baths
2,576
Sq Ft
$194/Sq Ft
Est. Value
About This Home
This home is located at 511 E 380 N, American Fork, UT 84003 and is currently estimated at $500,909, approximately $194 per square foot. 511 E 380 N is a home located in Utah County with nearby schools including Forbes Elementary School, American Fork Junior High School, and American Fork High School.
Ownership History
Date
Name
Owned For
Owner Type
Purchase Details
Closed on
Aug 25, 2022
Sold by
Amp Trust
Bought by
Perkins Samuel Adams and Salazar Aileen Elizabeth
Current Estimated Value
Home Financials for this Owner
Home Financials are based on the most recent Mortgage that was taken out on this home.
Original Mortgage
$465,500
Outstanding Balance
$444,908
Interest Rate
5.3%
Mortgage Type
New Conventional
Estimated Equity
$56,001
Purchase Details
Closed on
Nov 15, 2010
Sold by
Prestwich Anna
Bought by
Prestwich Anna
Home Financials for this Owner
Home Financials are based on the most recent Mortgage that was taken out on this home.
Original Mortgage
$25,000
Interest Rate
4.23%
Mortgage Type
Credit Line Revolving
Purchase Details
Closed on
Jul 5, 2001
Sold by
Miller Anna Mae and Rhodes Anna Kristine M
Bought by
Prestwich Anna
Create a Home Valuation Report for This Property
The Home Valuation Report is an in-depth analysis detailing your home's value as well as a comparison with similar homes in the area
Home Values in the Area
Average Home Value in this Area
Purchase History
| Date | Buyer | Sale Price | Title Company |
|---|---|---|---|
| Perkins Samuel Adams | -- | Cottonwood Title | |
| Prestwich Anna | -- | Meridian Title Company | |
| Prestwich Anna | -- | Meridian Title Company | |
| Prestwich Anna | -- | -- |
Source: Public Records
Mortgage History
| Date | Status | Borrower | Loan Amount |
|---|---|---|---|
| Open | Perkins Samuel Adams | $465,500 | |
| Previous Owner | Prestwich Anna | $25,000 |
Source: Public Records
Tax History
| Year | Tax Paid | Tax Assessment Tax Assessment Total Assessment is a certain percentage of the fair market value that is determined by local assessors to be the total taxable value of land and additions on the property. | Land | Improvement |
|---|---|---|---|---|
| 2025 | $2,169 | $258,885 | -- | -- |
| 2024 | $2,169 | $240,955 | $0 | $0 |
| 2023 | $2,030 | $239,140 | $0 | $0 |
| 2022 | $2,358 | $274,120 | $0 | $0 |
| 2021 | $2,022 | $367,200 | $143,100 | $224,100 |
| 2020 | $1,893 | $333,400 | $127,800 | $205,600 |
| 2019 | $1,709 | $311,200 | $120,500 | $190,700 |
| 2018 | $1,581 | $275,400 | $109,600 | $165,800 |
| 2017 | $1,538 | $144,540 | $0 | $0 |
| 2016 | $1,490 | $130,130 | $0 | $0 |
| 2015 | $1,492 | $123,640 | $0 | $0 |
| 2014 | $1,441 | $117,810 | $0 | $0 |
Source: Public Records
Map
Nearby Homes
- 410 N 500 E
- 532 E 500 N
- 350 N 500 E
- 410 N 600 E
- 266 N 500 E
- 369 E 500 N
- 479 E 200 N
- 691 N 400 E Unit A & B Units
- 691 N 400 E Unit A & B
- 691 N 400 E
- 80 N 400 E Unit B-3
- 80 N 400 E Unit 4
- 807 N 150 E
- 783 N 150 E
- 793 N 150 E
- 1082 N 350 E
- 51 N 370 E
- 912 E Ellens St Unit 1
- 16 N 700 E Unit 21
- 931 E Ellens St Unit LOT 13
Your Personal Tour Guide
Ask me questions while you tour the home.