511 E Elm St Watseka, IL 60970
Estimated Value: $56,416 - $74,000
About This Home
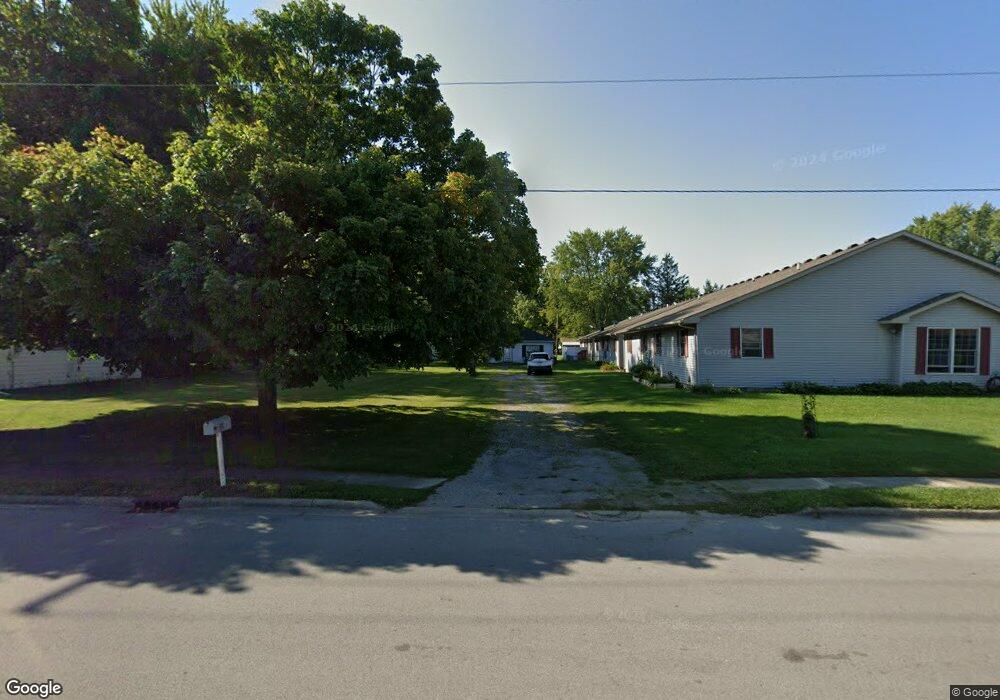
This home is located at 511 E Elm St, Watseka, IL 60970 and is currently estimated at $64,104, approximately $65 per square foot. 511 E Elm St is a home located in Iroquois County with nearby schools including Wanda Kendall Elementary School, Watseka Community High School, and Watseka Junior High School.
Ownership History
We collect this data history from publicly available records. To have your information removed, we recommend requesting removal directly through your county’s website.
Purchase Details
Home Financials for this Owner
Home Financials are based on the most recent Mortgage that was taken out on this home.Purchase Details
Purchase Details
Home Values in the Area
Average Home Value in this Area
Purchase History
We collect this data history from publicly available records. To have your information removed, we recommend requesting removal directly through your county’s website.
| Date | Buyer | Sale Price | Title Company |
|---|---|---|---|
| $22,000 | None Available | ||
| -- | Attorney | ||
| $5,000 | -- | ||
| $5,000 | -- |
Mortgage History
We collect this data history from publicly available records. To have your information removed, we recommend requesting removal directly through your county’s website.
| Date | Status | Borrower | Loan Amount |
|---|---|---|---|
| Open | $17,600 |
Tax History
We collect this data history from publicly available records. To have your information removed, we recommend requesting removal directly through your county’s website.
| Year | Tax Paid | Tax Assessment Tax Assessment Total Assessment is a certain percentage of the fair market value that is determined by local assessors to be the total taxable value of land and additions on the property. | Land | Improvement |
|---|---|---|---|---|
| 2024 | -- | $9,770 | $3,340 | $6,430 |
| 2023 | -- | $8,960 | $3,060 | $5,900 |
| 2022 | $0 | $7,520 | $2,570 | $4,950 |
| 2021 | $0 | $7,290 | $2,490 | $4,800 |
| 2020 | $0 | $7,790 | $2,660 | $5,130 |
| 2019 | $0 | $7,530 | $2,570 | $4,960 |
| 2018 | $1,029 | $7,333 | $2,500 | $4,833 |
| 2017 | $1,029 | $11,870 | $2,460 | $9,410 |
| 2016 | $687 | $11,870 | $2,460 | $9,410 |
| 2015 | $971 | $11,720 | $2,430 | $9,290 |
| 2014 | $971 | $11,510 | $2,390 | $9,120 |
| 2013 | $1,334 | $12,020 | $2,500 | $9,520 |
Map
- 322 N 6th St
- 714 E Rosewood St
- 427 E Oak St
- 551 N Clarence Ave
- 335 E Oak St
- 466 E Cherry St
- 745 E Oak St
- 313 N 5th St
- 109 E Sheridan St
- 312 N 4th St
- 320 E Locust St
- 544 E Mulberry St
- 850 E Locust St
- 429 N 3rd St
- 407 E Mulberry St
- 308 E Mulberry St
- 424 N 2nd St
- 23 Cedarwood Dr
- 410 S Ralph St
- 617 E Grant St
Ask me questions while you tour the home.