511 Front St Logansport, IN 46947
Estimated Value: $92,000 - $109,098
3
Beds
1
Bath
900
Sq Ft
$114/Sq Ft
Est. Value
About This Home
This home is located at 511 Front St, Logansport, IN 46947 and is currently estimated at $102,275, approximately $113 per square foot. 511 Front St is a home located in Cass County with nearby schools including Logansport Community High School and All Saints Catholic School.
Ownership History
Date
Name
Owned For
Owner Type
Purchase Details
Closed on
Jun 23, 2022
Sold by
Enyeart Real Estate Llc
Bought by
Cobra Kai Properties Llc
Current Estimated Value
Home Financials for this Owner
Home Financials are based on the most recent Mortgage that was taken out on this home.
Original Mortgage
$1,689,200
Outstanding Balance
$1,502,836
Interest Rate
5.1%
Mortgage Type
New Conventional
Estimated Equity
-$1,400,561
Purchase Details
Closed on
Jun 20, 2018
Sold by
Erik Leazenby and Erik Denise
Bought by
Enyeart Reale Estate Llc
Purchase Details
Closed on
Feb 3, 2009
Sold by
Mark D Ashby
Bought by
Enyeart Kevin S and Enyeart Bridget I
Purchase Details
Closed on
Dec 30, 2008
Sold by
Kevin S Enyeart
Bought by
Erik Leazenby and Denise Leazenby
Purchase Details
Closed on
Oct 9, 2008
Sold by
Mark D Ashby
Bought by
Kevin S Enyeart
Create a Home Valuation Report for This Property
The Home Valuation Report is an in-depth analysis detailing your home's value as well as a comparison with similar homes in the area
Home Values in the Area
Average Home Value in this Area
Purchase History
We collect this data history from publicly available records. To have your information removed, we recommend requesting removal directly through your county’s website.
| Date | Buyer | Sale Price | Title Company |
|---|---|---|---|
| Cobra Kai Properties Llc | -- | Klatch Louis | |
| Enyeart Reale Estate Llc | -- | Attorney Only | |
| Enyeart Kevin S | $24,000 | Security Federal Savings Bank | |
| Enyeart Kevin S | -- | Security Federal Savings Bank | |
| Erik Leazenby | $48,000 | Enyeart Real Estate, Llc | |
| Kevin S Enyeart | $24,000 | Michael & Stephenson |
Source: Public Records
Mortgage History
We collect this data history from publicly available records. To have your information removed, we recommend requesting removal directly through your county’s website.
| Date | Status | Borrower | Loan Amount |
|---|---|---|---|
| Open | Cobra Kai Properties Llc | $1,689,200 |
Source: Public Records
Tax History
| Year | Tax Paid | Tax Assessment Tax Assessment Total Assessment is a certain percentage of the fair market value that is determined by local assessors to be the total taxable value of land and additions on the property. | Land | Improvement |
|---|---|---|---|---|
| 2025 | $1,282 | $77,200 | $7,600 | $69,600 |
| 2024 | $1,144 | $64,100 | $7,600 | $56,500 |
| 2022 | $982 | $49,100 | $7,600 | $41,500 |
| 2021 | $776 | $38,800 | $7,200 | $31,600 |
| 2020 | $672 | $33,600 | $7,200 | $26,400 |
| 2019 | $626 | $31,300 | $7,200 | $24,100 |
| 2018 | $622 | $31,100 | $7,200 | $23,900 |
| 2017 | $668 | $33,400 | $7,200 | $26,200 |
| 2016 | $704 | $35,200 | $7,200 | $28,000 |
| 2014 | $279 | $37,400 | $7,200 | $30,200 |
| 2013 | $279 | $39,700 | $7,200 | $32,500 |
Source: Public Records
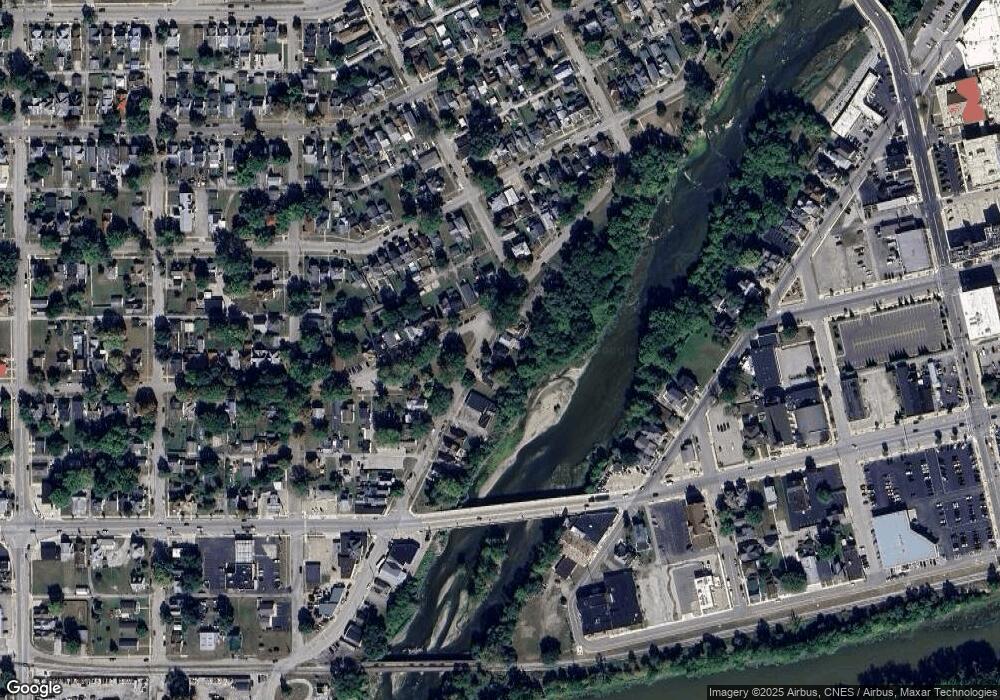
Map
Nearby Homes
Your Personal Tour Guide
Ask me questions while you tour the home.