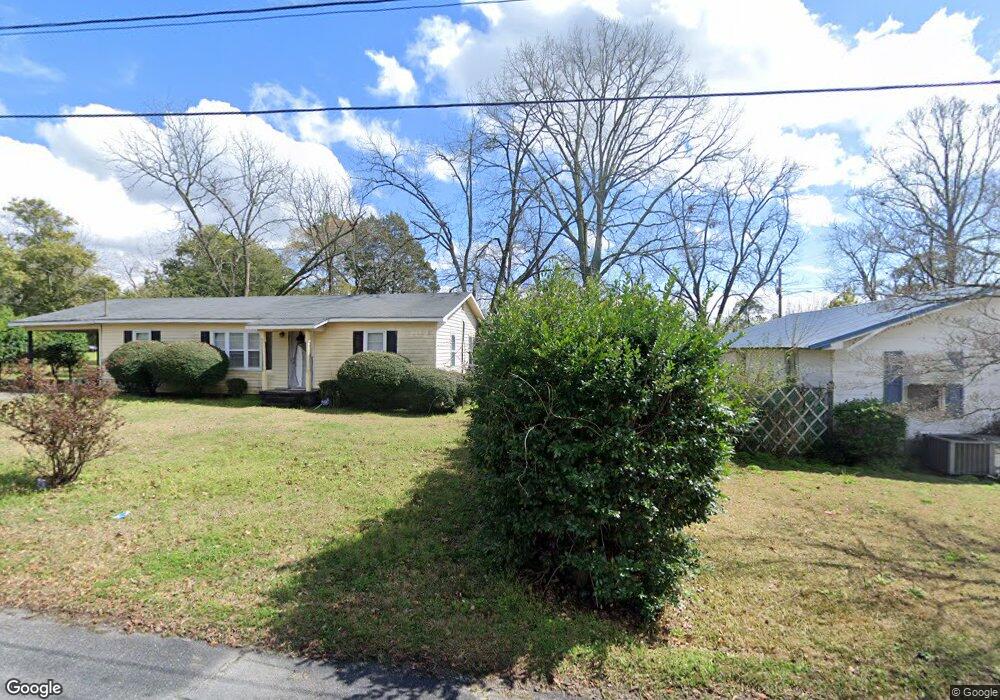
511 Peach St Cochran, GA 31014
Estimated Value: $100,000 - $187,000
About This Home
This home is located at 511 Peach St, Cochran, GA 31014 and is currently estimated at $152,645, approximately $97 per square foot. 511 Peach St is a home located in Bleckley County with nearby schools including Bleckley County Primary School, Bleckley County Elementary School, and Bleckley Middle School.
Ownership History
We collect this data history from publicly available records. To have your information removed, we recommend requesting removal directly through your county’s website.
Purchase Details
Purchase Details
Purchase Details
Home Financials for this Owner
Home Financials are based on the most recent Mortgage that was taken out on this home.Purchase Details
Purchase Details
Purchase Details
Purchase Details
Home Values in the Area
Average Home Value in this Area
Purchase History
We collect this data history from publicly available records. To have your information removed, we recommend requesting removal directly through your county’s website.
| Date | Buyer | Sale Price | Title Company |
|---|---|---|---|
| $25,000 | -- | ||
| $83,439 | -- | ||
| $83,439 | -- | ||
| $62,100 | -- | ||
| -- | -- | ||
| -- | -- | ||
| -- | -- | ||
| -- | -- |
Mortgage History
We collect this data history from publicly available records. To have your information removed, we recommend requesting removal directly through your county’s website.
| Date | Status | Borrower | Loan Amount |
|---|---|---|---|
| Previous Owner | $58,995 |
Tax History
We collect this data history from publicly available records. To have your information removed, we recommend requesting removal directly through your county’s website.
| Year | Tax Paid | Tax Assessment Tax Assessment Total Assessment is a certain percentage of the fair market value that is determined by local assessors to be the total taxable value of land and additions on the property. | Land | Improvement |
|---|---|---|---|---|
| 2025 | $1,748 | $48,208 | $2,400 | $45,808 |
| 2024 | $1,725 | $47,208 | $2,400 | $44,808 |
| 2023 | $728 | $47,208 | $2,400 | $44,808 |
| 2022 | $1,086 | $41,928 | $2,400 | $39,528 |
| 2021 | $764 | $28,904 | $2,400 | $26,504 |
| 2020 | $767 | $28,904 | $2,400 | $26,504 |
| 2019 | $635 | $24,271 | $1,760 | $22,511 |
| 2018 | $981 | $24,271 | $1,760 | $22,511 |
| 2017 | $643 | $24,271 | $1,760 | $22,511 |
| 2016 | $650 | $24,271 | $1,760 | $22,511 |
| 2015 | -- | $24,271 | $1,760 | $22,511 |
| 2014 | -- | $24,271 | $1,760 | $22,511 |
| 2013 | -- | $24,270 | $1,760 | $22,510 |
Map
- 118 Edmondson Cir
- 118 Pecan St
- 116 Pecan St
- 0 Limestone Rd Unit 25839040
- 0 Limestone Rd Unit 10659326
- 1277 Georgia 112
- 116 W Lewis St
- 167 W Lakeshore Dr
- 145 SE 2nd St
- 0 Willow Creek Run
- 104 S 4th St
- 0 Tiffany Dr Unit 10771058
- 0 Tiffany Dr Unit 131
- 161 E Cherry St
- 283 Limestone Rd
- 188 E Lewis St
- 168 Crest Dr
- 260 Ann St
- 264 Ann St
- 0 Wood Oak Cir Unit 233873
Ask me questions while you tour the home.