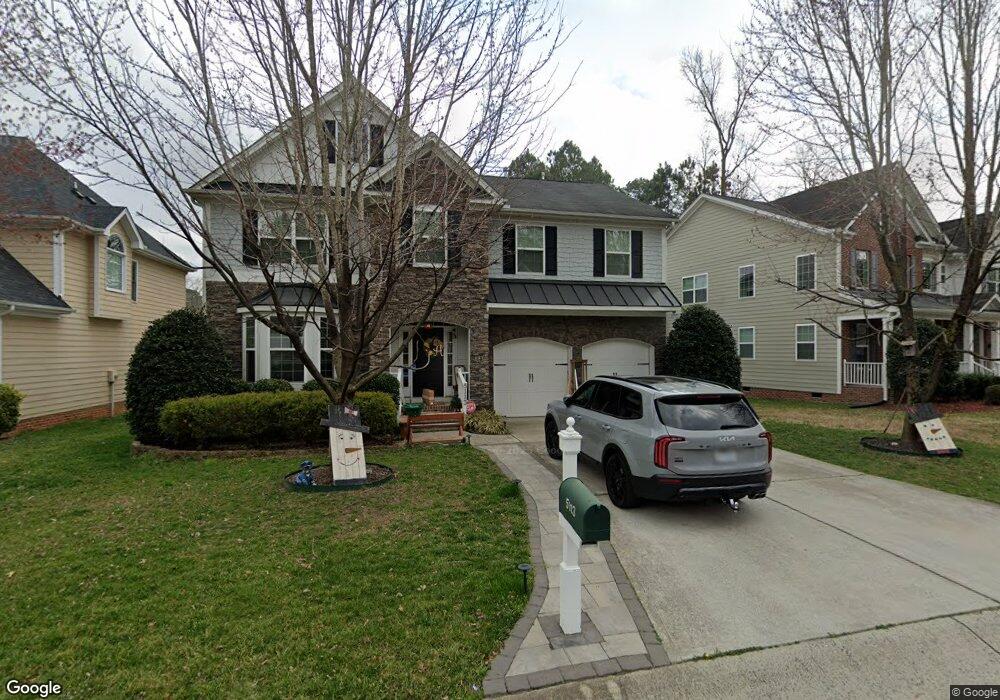
5113 Paces Ferry Dr Durham, NC 27712
North Durham NeighborhoodEstimated Value: $517,746 - $556,000
4
Beds
3
Baths
2,843
Sq Ft
$189/Sq Ft
Est. Value
About This Home
This home is located at 5113 Paces Ferry Dr, Durham, NC 27712 and is currently estimated at $537,687, approximately $189 per square foot. 5113 Paces Ferry Dr is a home located in Durham County with nearby schools including Eno Valley Elementary, George L Carrington Middle, and Northern High School.
Ownership History
Date
Name
Owned For
Owner Type
Purchase Details
Closed on
Oct 24, 2012
Sold by
Drh Energy Inc
Bought by
Anthony David M and Anthony Lindsay M
Current Estimated Value
Purchase Details
Closed on
Aug 30, 2010
Sold by
D R Horton Inc
Bought by
Anthony David M and Anthony Lindsy M
Home Financials for this Owner
Home Financials are based on the most recent Mortgage that was taken out on this home.
Original Mortgage
$243,850
Interest Rate
3.25%
Mortgage Type
FHA
Create a Home Valuation Report for This Property
The Home Valuation Report is an in-depth analysis detailing your home's value as well as a comparison with similar homes in the area
Home Values in the Area
Average Home Value in this Area
Purchase History
| Date | Buyer | Sale Price | Title Company |
|---|---|---|---|
| Anthony David M | -- | None Available | |
| Anthony David M | $248,500 | None Available |
Source: Public Records
Mortgage History
| Date | Status | Borrower | Loan Amount |
|---|---|---|---|
| Previous Owner | Anthony David M | $243,850 |
Source: Public Records
Tax History
| Year | Tax Paid | Tax Assessment Tax Assessment Total Assessment is a certain percentage of the fair market value that is determined by local assessors to be the total taxable value of land and additions on the property. | Land | Improvement |
|---|---|---|---|---|
| 2025 | $5,362 | $540,921 | $75,625 | $465,296 |
| 2024 | $4,219 | $302,461 | $48,280 | $254,181 |
| 2023 | $3,944 | $301,074 | $48,280 | $252,794 |
| 2022 | $3,853 | $301,074 | $48,280 | $252,794 |
| 2021 | $3,835 | $301,074 | $48,280 | $252,794 |
| 2020 | $3,745 | $301,074 | $48,280 | $252,794 |
| 2019 | $3,745 | $301,074 | $48,280 | $252,794 |
| 2018 | $3,693 | $272,210 | $48,280 | $223,930 |
| 2017 | $3,665 | $272,210 | $48,280 | $223,930 |
| 2016 | $3,542 | $272,210 | $48,280 | $223,930 |
| 2015 | $3,931 | $283,988 | $51,186 | $232,802 |
| 2014 | $3,931 | $283,988 | $51,186 | $232,802 |
Source: Public Records
Map
Nearby Homes
- 4502 Paces Ferry Dr
- 5620 Birch Dr
- 1224 Bramble Dr
- 5502 Ripplebrook Rd
- 4 Tall Leaf Trail
- 5410 Ripplebrook Rd
- 1303 Imperial Dr
- 5406 Ripplebrook Dr
- 5610 Genesee Dr
- 1417 Barliff Place
- 1409 Cotherstone Dr
- 4 Amador Place
- 427 Vivaldi Dr
- 5820 Genesee Dr
- 5805 Prioress Dr
- 5809 Prioress Dr
- 5801 Prioress Dr
- 5022 Green Oak Dr
- 5857 Genesee Dr
- 1109 Prominence Dr
- 5115 Paces Ferry Dr
- 5111 Paces Ferry Dr
- 5117 Paces Ferry Dr
- 5109 Paces Ferry Dr
- 15 Brightfield Ln
- 13 Brightfield Ln
- 5114 Paces Ferry Dr
- 5119 Paces Ferry Dr
- 5116 Paces Ferry Dr
- 5107 Paces Ferry Dr
- 5110 Paces Ferry Dr
- 5112 Paces Ferry Dr
- 5108 Paces Ferry Dr
- 5118 Paces Ferry Dr
- 11 Brightleaf Ct
- 11 Brightfield Ln
- 5201 Paces Ferry Dr
- 5120 Paces Ferry Dr
- 5106 Paces Ferry Dr
- 5105 Paces Ferry Dr
Your Personal Tour Guide
Ask me questions while you tour the home.