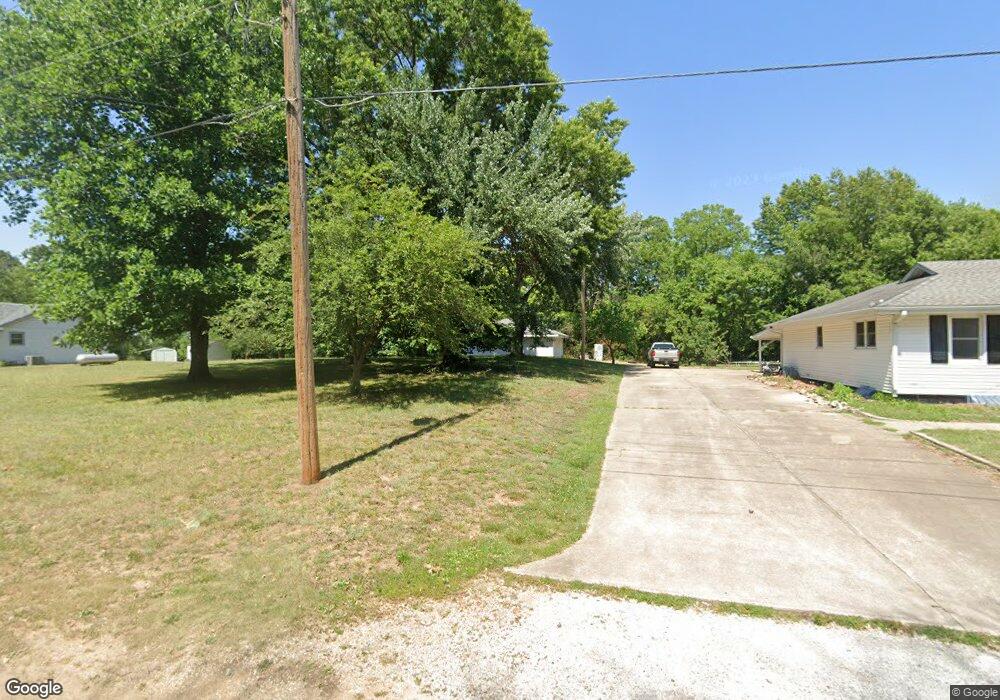
512 Cedar St Osceola, MO 64776
Estimated Value: $178,879 - $327,000
2
Beds
2
Baths
1,724
Sq Ft
$139/Sq Ft
Est. Value
About This Home
This home is located at 512 Cedar St, Osceola, MO 64776 and is currently estimated at $239,970, approximately $139 per square foot. 512 Cedar St is a home located in St. Clair County with nearby schools including Osceola Elementary School and Osceola Junior/Senior High School.
Ownership History
Date
Name
Owned For
Owner Type
Purchase Details
Closed on
Mar 29, 2024
Sold by
Self Derek A and Self Tayler J
Bought by
Hamby Larry J and Hamby Martha C
Current Estimated Value
Purchase Details
Closed on
Aug 24, 2018
Sold by
Pierce Rebecca Lee and Pierce Steven K
Bought by
Self Derek A
Purchase Details
Closed on
Oct 3, 2007
Sold by
Conner Donald R and Conner Debraoh A
Bought by
Pierece Rebecca Lee and Pierece Steven K
Home Financials for this Owner
Home Financials are based on the most recent Mortgage that was taken out on this home.
Original Mortgage
$81,000
Interest Rate
6.47%
Mortgage Type
New Conventional
Create a Home Valuation Report for This Property
The Home Valuation Report is an in-depth analysis detailing your home's value as well as a comparison with similar homes in the area
Purchase History
We collect this data history from publicly available records. To have your information removed, we recommend requesting removal directly through your county’s website.
| Date | Buyer | Sale Price | Title Company |
|---|---|---|---|
| Hamby Larry J | -- | None Listed On Document | |
| Self Derek A | -- | None Available | |
| Pierece Rebecca Lee | -- | None Available |
Source: Public Records
Mortgage History
We collect this data history from publicly available records. To have your information removed, we recommend requesting removal directly through your county’s website.
| Date | Status | Borrower | Loan Amount |
|---|---|---|---|
| Previous Owner | Pierece Rebecca Lee | $81,000 |
Source: Public Records
Tax History
| Year | Tax Paid | Tax Assessment Tax Assessment Total Assessment is a certain percentage of the fair market value that is determined by local assessors to be the total taxable value of land and additions on the property. | Land | Improvement |
|---|---|---|---|---|
| 2025 | $1,298 | $18,900 | $0 | $0 |
| 2024 | $1,196 | $18,900 | $0 | $0 |
| 2023 | $0 | $18,900 | $0 | $0 |
| 2022 | $1,178 | $18,900 | $0 | $0 |
| 2021 | $1,176 | $18,900 | $0 | $0 |
| 2020 | $1,158 | $18,400 | $0 | $0 |
| 2019 | $1,154 | $18,400 | $0 | $0 |
| 2018 | $1,154 | $18,400 | $0 | $0 |
| 2017 | $1,224 | $18,400 | $0 | $0 |
| 2016 | $1,229 | $18,400 | $0 | $0 |
| 2015 | $1,224 | $18,400 | $0 | $0 |
| 2014 | -- | $18,900 | $0 | $0 |
| 2013 | -- | $18,900 | $0 | $0 |
Source: Public Records
Map
Nearby Homes
Your Personal Tour Guide
Ask me questions while you tour the home.