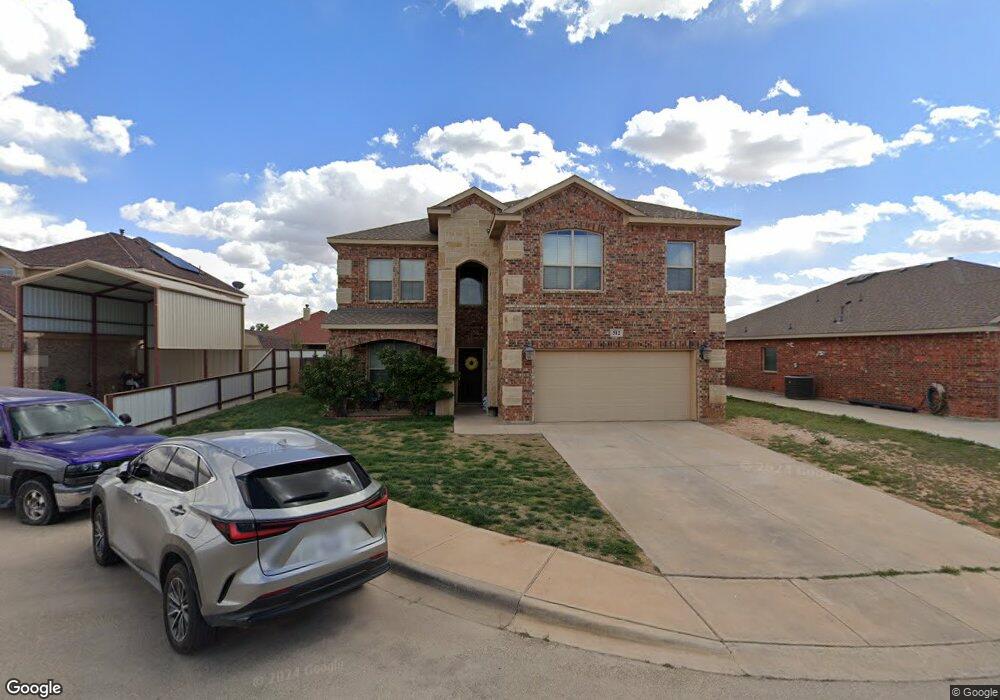
512 Mccraw Ct Odessa, TX 79765
Estimated Value: $307,000 - $348,000
Studio
--
Bath
2,233
Sq Ft
$147/Sq Ft
Est. Value
About This Home
This home is located at 512 Mccraw Ct, Odessa, TX 79765 and is currently estimated at $328,807, approximately $147 per square foot. 512 Mccraw Ct is a home with nearby schools including Barbara Jordan Elementary School, Wilson & Young Medal of Honor Middle School, and Permian High School.
Ownership History
Date
Name
Owned For
Owner Type
Purchase Details
Closed on
Apr 21, 2014
Sold by
D R Horton Texas Ltd
Bought by
Luna Orlando C and Vasquez Valerie A
Current Estimated Value
Home Financials for this Owner
Home Financials are based on the most recent Mortgage that was taken out on this home.
Original Mortgage
$248,672
Outstanding Balance
$188,575
Interest Rate
4.43%
Mortgage Type
FHA
Estimated Equity
$140,232
Create a Home Valuation Report for This Property
The Home Valuation Report is an in-depth analysis detailing your home's value as well as a comparison with similar homes in the area
Purchase History
We collect this data history from publicly available records. To have your information removed, we recommend requesting removal directly through your county’s website.
| Date | Buyer | Sale Price | Title Company |
|---|---|---|---|
| Luna Orlando C | -- | Basin Abstract & Title |
Source: Public Records
Mortgage History
We collect this data history from publicly available records. To have your information removed, we recommend requesting removal directly through your county’s website.
| Date | Status | Borrower | Loan Amount |
|---|---|---|---|
| Open | Luna Orlando C | $248,672 |
Source: Public Records
Tax History
| Year | Tax Paid | Tax Assessment Tax Assessment Total Assessment is a certain percentage of the fair market value that is determined by local assessors to be the total taxable value of land and additions on the property. | Land | Improvement |
|---|---|---|---|---|
| 2025 | $4,177 | $329,967 | $23,326 | $306,641 |
| 2024 | $4,330 | $315,075 | $23,326 | $291,749 |
| 2023 | $4,231 | $309,361 | $23,326 | $286,035 |
| 2022 | $6,966 | $301,507 | $23,326 | $278,181 |
| 2021 | $7,059 | $299,253 | $23,326 | $275,927 |
| 2020 | $6,783 | $292,475 | $23,326 | $269,149 |
| 2019 | $6,560 | $266,082 | $23,326 | $242,756 |
| 2018 | $5,740 | $243,796 | $23,326 | $220,470 |
| 2017 | $5,610 | $246,298 | $23,326 | $222,972 |
| 2016 | $7,413 | $333,896 | $18,387 | $315,509 |
| 2015 | -- | $333,896 | $18,387 | $315,509 |
Source: Public Records
Map
Nearby Homes
Your Personal Tour Guide
Ask me questions while you tour the home.