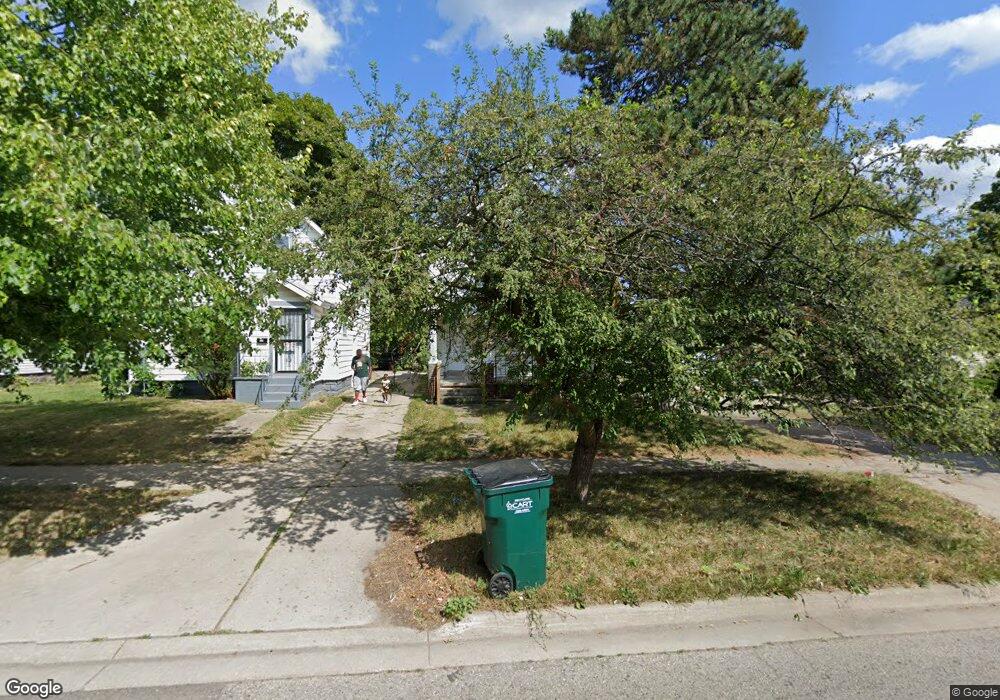
512 N Pine St Unit 1 Lansing, MI 48933
Downtown Lansing NeighborhoodEstimated Value: $96,000 - $140,000
4
Beds
2
Baths
4
Sq Ft
$29,002/Sq Ft
Est. Value
About This Home
This home is located at 512 N Pine St Unit 1, Lansing, MI 48933 and is currently estimated at $116,006, approximately $29,001 per square foot. 512 N Pine St Unit 1 is a home located in Ingham County with nearby schools including Riddle Elementary School, Pattengill Academy, and J.W. Sexton High School.
Ownership History
Date
Name
Owned For
Owner Type
Purchase Details
Closed on
Jul 15, 2019
Sold by
Complete Housing Solution Llc
Bought by
Tillguard Llc
Current Estimated Value
Purchase Details
Closed on
Dec 10, 2012
Sold by
Lambert George H and Lambert Teresa A
Bought by
Complete Housing Solution Llc
Home Financials for this Owner
Home Financials are based on the most recent Mortgage that was taken out on this home.
Original Mortgage
$22,364
Interest Rate
3.3%
Mortgage Type
New Conventional
Purchase Details
Closed on
Jun 12, 2012
Sold by
Frieling Cameron
Bought by
Lambert George H and Huber Dale D
Purchase Details
Closed on
Feb 2, 2012
Sold by
Frieling Cameron
Bought by
Wells Fargo Bank Na
Purchase Details
Closed on
Mar 19, 2009
Sold by
Dehaven Craig E
Bought by
Frieling Cameron
Home Financials for this Owner
Home Financials are based on the most recent Mortgage that was taken out on this home.
Original Mortgage
$75,010
Interest Rate
5.05%
Mortgage Type
FHA
Purchase Details
Closed on
Jan 30, 2008
Sold by
Fannie Mae
Bought by
Dehaven Craig E
Purchase Details
Closed on
Jan 18, 2007
Sold by
Xie Zhenwei
Bought by
Central Mortgage Co
Purchase Details
Closed on
Dec 2, 2003
Sold by
Michigan Home Buyers Realty Inc
Bought by
Xie Zhenwei
Home Financials for this Owner
Home Financials are based on the most recent Mortgage that was taken out on this home.
Original Mortgage
$47,680
Interest Rate
5%
Mortgage Type
Purchase Money Mortgage
Purchase Details
Closed on
Nov 24, 2003
Sold by
Fedewa James R and Fedewa Mary Ann
Bought by
Xie Zhenwei
Home Financials for this Owner
Home Financials are based on the most recent Mortgage that was taken out on this home.
Original Mortgage
$47,680
Interest Rate
5%
Mortgage Type
Purchase Money Mortgage
Purchase Details
Closed on
Aug 27, 2003
Sold by
Ballard Jerome W and Ballard Rosalie
Bought by
Haveman Louis J and Haveman Jeffery J
Purchase Details
Closed on
Aug 11, 2003
Sold by
Haveman Louis J and Haveman Janice
Bought by
Fedewa James R and Fedewa David D
Purchase Details
Closed on
Feb 19, 2003
Sold by
Vermett Lottie and Fedewa David
Bought by
Fedewa James R and Fedewa David D
Purchase Details
Closed on
Aug 2, 2002
Sold by
Jb Investments
Bought by
Pine Street Trust
Purchase Details
Closed on
Aug 15, 1996
Sold by
Haveman Louis J and Haveman Janice
Bought by
Vermett Jack and Fedewa David
Purchase Details
Closed on
Jun 3, 1993
Sold by
Ballard Jerome W and Ballard Rosalie
Bought by
Haveman Louis J and Haveman Jeffery J
Create a Home Valuation Report for This Property
The Home Valuation Report is an in-depth analysis detailing your home's value as well as a comparison with similar homes in the area
Home Values in the Area
Average Home Value in this Area
Purchase History
| Date | Buyer | Sale Price | Title Company |
|---|---|---|---|
| Tillguard Llc | -- | None Available | |
| Complete Housing Solution Llc | -- | None Available | |
| Lambert George H | -- | None Available | |
| Lambert George H | $500 | None Available | |
| Huber Dale D | -- | None Available | |
| Lambert George H | -- | None Available | |
| Wells Fargo Bank Na | $8,800 | None Available | |
| Frieling Cameron | $76,000 | Title Partners | |
| Dehaven Craig E | $20,000 | Itc | |
| Central Mortgage Co | $53,398 | None Available | |
| Federal National Mortgage Association | -- | None Available | |
| Xie Zhenwei | -- | -- | |
| Xie Zhenwei | $59,600 | -- | |
| Haveman Louis J | $22,500 | -- | |
| Fedewa James R | $26,000 | -- | |
| Fedewa James R | -- | -- | |
| Pine Street Trust | -- | -- | |
| Vermett Jack | $26,000 | -- | |
| Haveman Louis J | $22,500 | -- |
Source: Public Records
Mortgage History
| Date | Status | Borrower | Loan Amount |
|---|---|---|---|
| Previous Owner | Complete Housing Solution Llc | $22,364 | |
| Previous Owner | Frieling Cameron | $75,010 | |
| Previous Owner | Xie Zhenwei | $47,680 |
Source: Public Records
Tax History
| Year | Tax Paid | Tax Assessment Tax Assessment Total Assessment is a certain percentage of the fair market value that is determined by local assessors to be the total taxable value of land and additions on the property. | Land | Improvement |
|---|---|---|---|---|
| 2025 | $3,234 | $47,700 | $3,800 | $43,900 |
| 2024 | $27 | $45,300 | $3,800 | $41,500 |
| 2023 | $3,193 | $40,800 | $3,800 | $37,000 |
| 2022 | $2,778 | $36,700 | $4,100 | $32,600 |
| 2021 | $2,713 | $35,400 | $5,300 | $30,100 |
| 2020 | $2,694 | $33,300 | $5,300 | $28,000 |
| 2019 | $2,127 | $30,300 | $5,300 | $25,000 |
| 2018 | $2,018 | $26,100 | $5,300 | $20,800 |
| 2017 | $1,942 | $26,100 | $5,300 | $20,800 |
| 2016 | $1,979 | $25,700 | $5,300 | $20,400 |
| 2015 | $1,979 | $25,000 | $10,500 | $14,500 |
| 2014 | $1,979 | $26,200 | $17,000 | $9,200 |
Source: Public Records
Map
Nearby Homes
- 506 N Sycamore St
- 425 N Sycamore St
- 514 N Walnut St
- 612 N Walnut St
- 309 W Lapeer St
- 325 N Sycamore St
- 516 W Ionia St
- 420 W Ionia St
- 312 W Saginaw St Unit 1
- 733 N Walnut St
- 411 W Ionia St
- 821 N Chestnut St
- 433 N Butler Blvd
- 425/425.5 N Butler Blvd
- 427 N Butler Blvd
- 902 W Shiawassee St
- 809 Seymour Ave
- 908 N Pine St
- 904 N Sycamore St
- 905 N Sycamore St
Your Personal Tour Guide
Ask me questions while you tour the home.