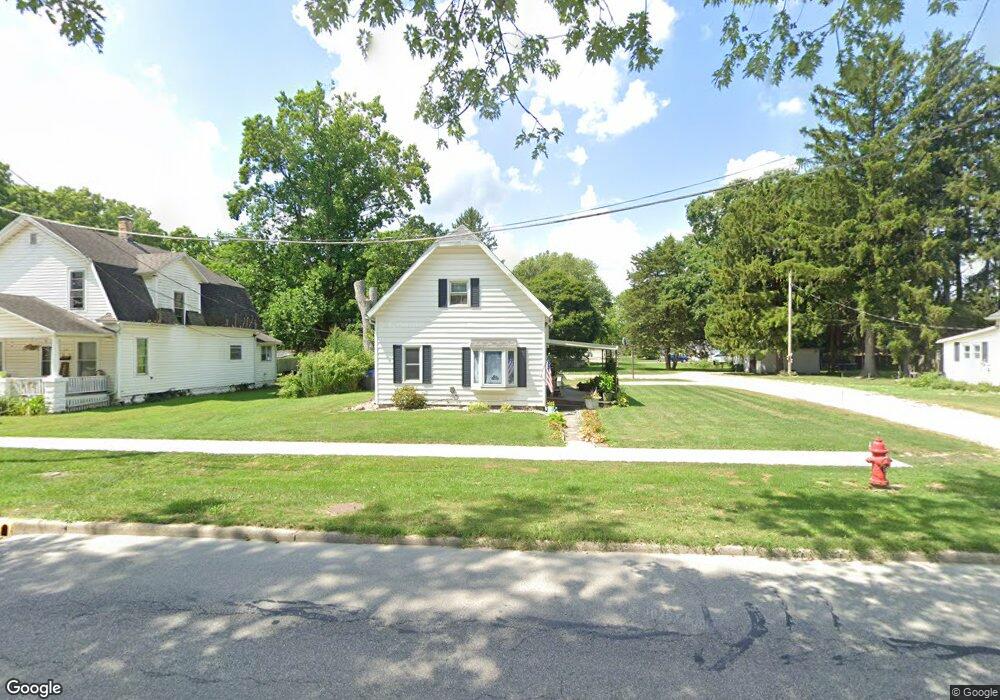
512 S Main St Bourbon, IN 46504
Estimated Value: $136,000 - $192,000
About This Home
This home is located at 512 S Main St, Bourbon, IN 46504 and is currently estimated at $172,151, approximately $116 per square foot. 512 S Main St is a home located in Marshall County with nearby schools including Triton Elementary School, Triton Junior-Senior High School, and Bourbon Christian School.
Ownership History
We collect this data history from publicly available records. To have your information removed, we recommend requesting removal directly through your county’s website.
Purchase Details
Home Financials for this Owner
Home Financials are based on the most recent Mortgage that was taken out on this home.Purchase History
We collect this data history from publicly available records. To have your information removed, we recommend requesting removal directly through your county’s website.
| Date | Buyer | Sale Price | Title Company |
|---|---|---|---|
| -- | None Available |
Mortgage History
We collect this data history from publicly available records. To have your information removed, we recommend requesting removal directly through your county’s website.
| Date | Status | Borrower | Loan Amount |
|---|---|---|---|
| Closed | $64,000 |
Tax History
We collect this data history from publicly available records. To have your information removed, we recommend requesting removal directly through your county’s website.
| Year | Tax Paid | Tax Assessment Tax Assessment Total Assessment is a certain percentage of the fair market value that is determined by local assessors to be the total taxable value of land and additions on the property. | Land | Improvement |
|---|---|---|---|---|
| 2025 | $1,009 | $129,200 | $15,700 | $113,500 |
| 2024 | $951 | $102,600 | $15,700 | $86,900 |
| 2022 | $951 | $103,000 | $15,700 | $87,300 |
| 2021 | $758 | $84,000 | $13,100 | $70,900 |
| 2020 | $816 | $85,200 | $13,100 | $72,100 |
| 2019 | $670 | $78,200 | $12,100 | $66,100 |
| 2018 | $639 | $75,100 | $11,600 | $63,500 |
| 2017 | $611 | $75,000 | $11,600 | $63,400 |
| 2016 | $561 | $73,100 | $11,600 | $61,500 |
| 2014 | $565 | $70,900 | $11,600 | $59,300 |
Map
- 301 S Bourbon St
- 207 E Center St
- 446 E Center St
- 405 N Lincoln St
- 707 Crocus Ct
- 1336 Lincoln Hwy
- 1027 12th Rd
- 131 S Main St
- 10985 W 250 N
- 116 S Walnut St
- 205 E Spring St
- 8983 Chestnut Rd
- 10682 Hawthorn Rd Unit 14
- 18189 State Road 331
- 2880 18b Rd
- 9135 W 750 N
- 14229 Juniper Rd
- 2777 6th Rd
- 0 TBD Lutes Dr
- 10020 15th Rd
Ask me questions while you tour the home.