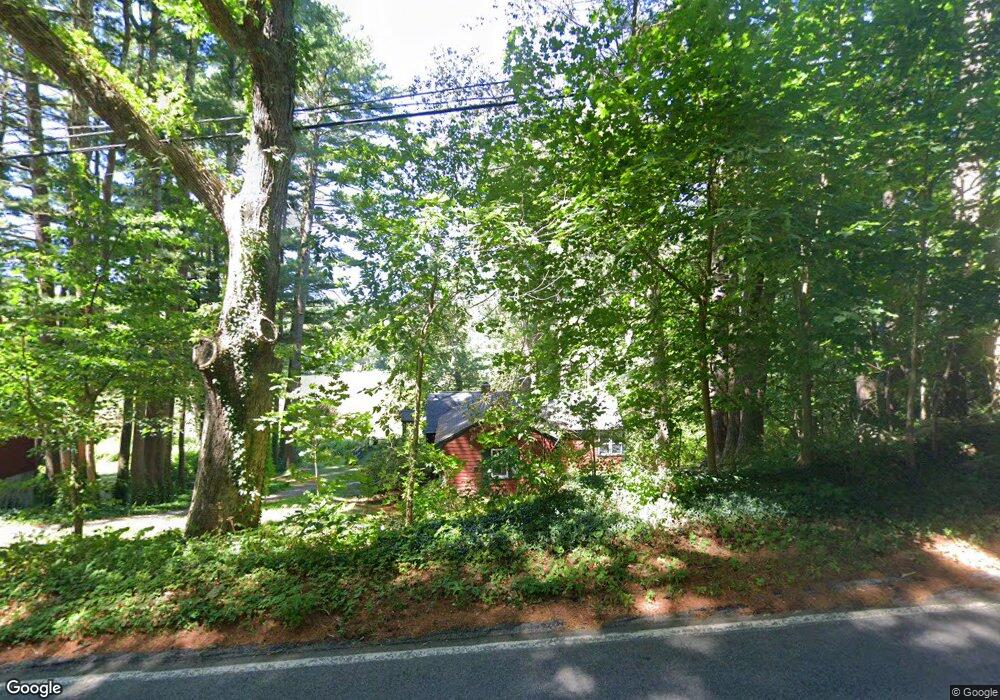
512 Spring St Marshfield, MA 02050
Estimated Value: $744,628 - $973,000
3
Beds
2
Baths
1,416
Sq Ft
$627/Sq Ft
Est. Value
About This Home
This home is located at 512 Spring St, Marshfield, MA 02050 and is currently estimated at $887,657, approximately $626 per square foot. 512 Spring St is a home with nearby schools including Martinson Elementary School, Furnace Brook Middle School, and Marshfield High School.
Ownership History
Date
Name
Owned For
Owner Type
Purchase Details
Closed on
Jan 25, 2007
Sold by
Crosby Judith G
Bought by
Judith G Crosby T and Crosby Judith G
Current Estimated Value
Purchase Details
Closed on
Aug 10, 1993
Sold by
Rich Ethel C and Wilson Penelope R
Bought by
Crosby Judith G
Home Financials for this Owner
Home Financials are based on the most recent Mortgage that was taken out on this home.
Original Mortgage
$75,000
Interest Rate
7.29%
Mortgage Type
Purchase Money Mortgage
Create a Home Valuation Report for This Property
The Home Valuation Report is an in-depth analysis detailing your home's value as well as a comparison with similar homes in the area
Home Values in the Area
Average Home Value in this Area
Purchase History
| Date | Buyer | Sale Price | Title Company |
|---|---|---|---|
| Judith G Crosby T | -- | -- | |
| Crosby Judith G | $185,000 | -- |
Source: Public Records
Mortgage History
| Date | Status | Borrower | Loan Amount |
|---|---|---|---|
| Previous Owner | Crosby Judith G | $19,900 | |
| Previous Owner | Crosby Judith G | $75,000 |
Source: Public Records
Tax History
| Year | Tax Paid | Tax Assessment Tax Assessment Total Assessment is a certain percentage of the fair market value that is determined by local assessors to be the total taxable value of land and additions on the property. | Land | Improvement |
|---|---|---|---|---|
| 2025 | $6,945 | $701,500 | $460,400 | $241,100 |
| 2024 | $7,063 | $679,800 | $460,400 | $219,400 |
| 2023 | $7,370 | $618,300 | $414,400 | $203,900 |
| 2022 | $7,370 | $569,100 | $394,500 | $174,600 |
| 2021 | $6,770 | $513,300 | $351,000 | $162,300 |
| 2020 | $6,806 | $510,600 | $351,000 | $159,600 |
| 2019 | $6,338 | $473,700 | $329,200 | $144,500 |
| 2018 | $6,279 | $469,600 | $329,200 | $140,400 |
| 2017 | $6,081 | $443,200 | $307,400 | $135,800 |
| 2016 | $5,548 | $399,700 | $274,800 | $124,900 |
| 2015 | $4,913 | $369,700 | $253,000 | $116,700 |
| 2014 | $4,730 | $355,900 | $242,100 | $113,800 |
Source: Public Records
Map
Nearby Homes
- 32 Carolyn Cir
- 95 Stony Brook Ln
- 2167 Main St
- 480 Pleasant St
- 29 Shepherd's Path
- 3 Harbor Ln
- 9 Cushing Park Rd
- 1155 Main St
- 138 Judge Cushing Rd
- 60 Samuel Curtis Way
- 316 Summer St
- 3 Webster Farm Way
- 5 Webster Farm Way
- 34 Ladds Way
- 25 Webster Farm Way
- 23 Webster Farm Way
- 889 Old Main Street Extension
- 19 Ford Place Unit 1
- 19 Ford Place Unit 2
- 94 Old Oaken Bucket Rd
Your Personal Tour Guide
Ask me questions while you tour the home.