Estimated Value: $98,000 - $425,000
Studio
--
Bath
--
Sq Ft
43,560
Sq Ft Lot
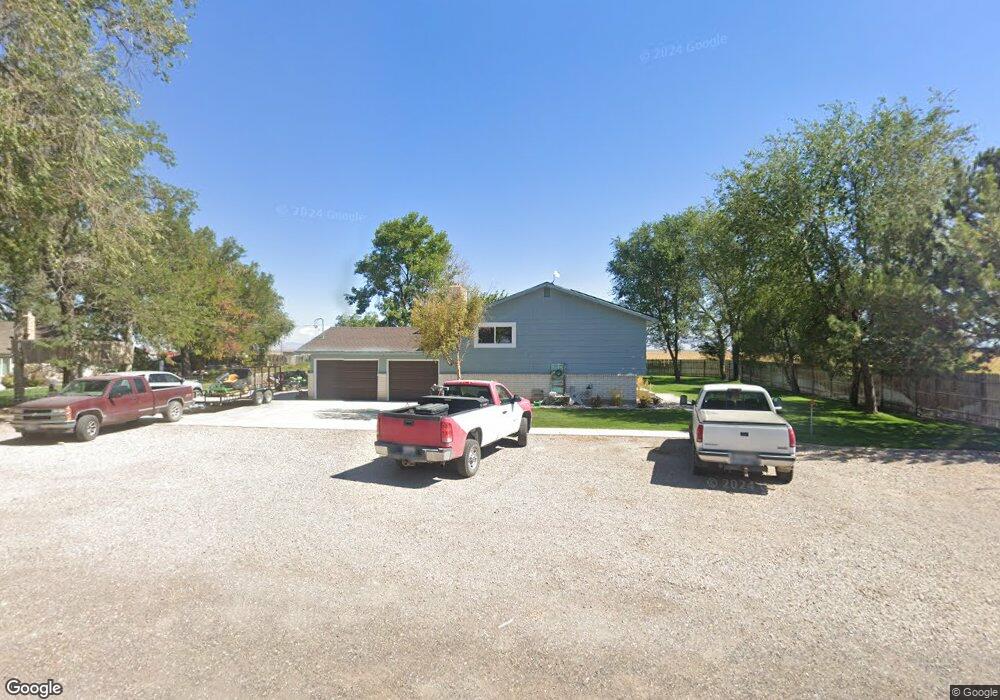
About This Home
This home is located at 5120 N 2000 W, Delta, UT 84624 and is currently estimated at $311,902. 5120 N 2000 W is a home.
Ownership History
Date
Name
Owned For
Owner Type
Purchase Details
Closed on
May 9, 2013
Sold by
Lyman John L and The Frank A Lyman Family Trust
Bought by
Bryan Daniel C and Bryan Casey
Current Estimated Value
Home Financials for this Owner
Home Financials are based on the most recent Mortgage that was taken out on this home.
Original Mortgage
$137,750
Outstanding Balance
$96,632
Interest Rate
3.41%
Mortgage Type
New Conventional
Estimated Equity
$215,270
Purchase Details
Closed on
Jun 14, 2012
Sold by
Lyman John L
Bought by
Lyman Ray E and Lyman Colleen M
Home Financials for this Owner
Home Financials are based on the most recent Mortgage that was taken out on this home.
Original Mortgage
$513,675
Interest Rate
3.79%
Create a Home Valuation Report for This Property
The Home Valuation Report is an in-depth analysis detailing your home's value as well as a comparison with similar homes in the area
Purchase History
| Date | Buyer | Sale Price | Title Company |
|---|---|---|---|
| Bryan Daniel C | -- | -- | |
| Lyman Ray E | -- | First American Title Insuran |
Source: Public Records
Mortgage History
| Date | Status | Borrower | Loan Amount |
|---|---|---|---|
| Open | Bryan Daniel C | $137,750 | |
| Previous Owner | Lyman Ray E | $513,675 |
Source: Public Records
Tax History
| Year | Tax Paid | Tax Assessment Tax Assessment Total Assessment is a certain percentage of the fair market value that is determined by local assessors to be the total taxable value of land and additions on the property. | Land | Improvement |
|---|---|---|---|---|
| 2025 | $1,692 | $204,591 | $19,250 | $185,341 |
| 2024 | $1,692 | $203,215 | $13,750 | $189,465 |
| 2023 | $1,871 | $203,215 | $13,750 | $189,465 |
| 2022 | $1,510 | $131,012 | $13,750 | $117,262 |
| 2021 | $1,186 | $98,740 | $12,100 | $86,640 |
| 2020 | $1,138 | $95,379 | $12,100 | $83,279 |
| 2019 | $1,098 | $92,765 | $12,100 | $80,665 |
| 2018 | $948 | $81,731 | $12,100 | $69,631 |
| 2017 | $981 | $78,431 | $8,800 | $69,631 |
| 2016 | $940 | $78,431 | $8,800 | $69,631 |
| 2015 | $939 | $78,431 | $8,800 | $69,631 |
| 2014 | -- | $78,431 | $8,800 | $69,631 |
| 2013 | -- | $83,754 | $8,800 | $74,954 |
Source: Public Records
Map
Nearby Homes
Your Personal Tour Guide
Ask me questions while you tour the home.