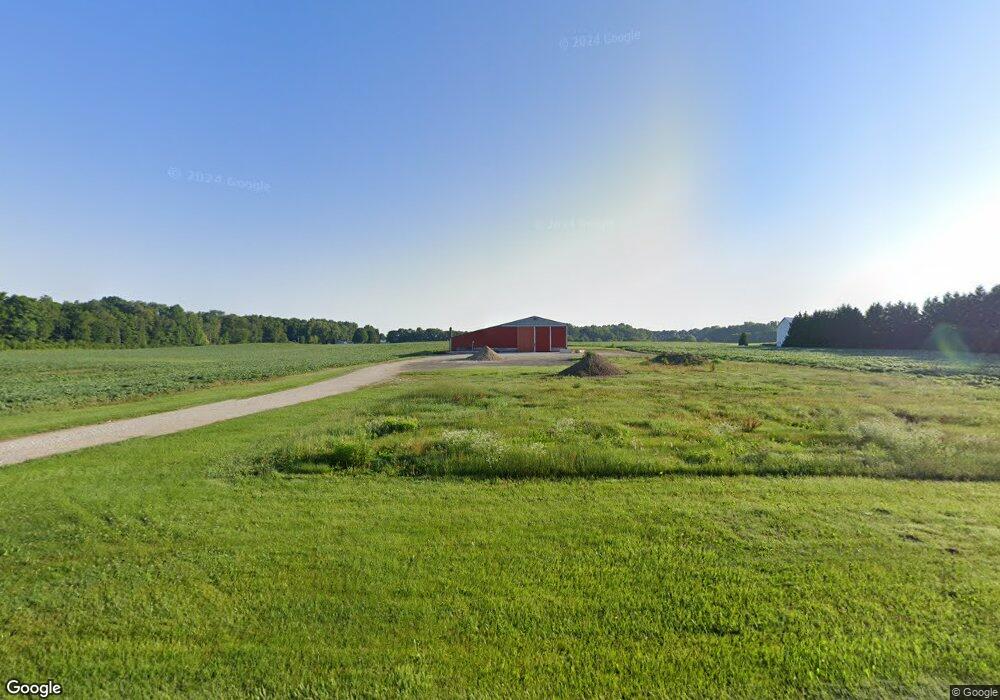
5124 E 1000 S Claypool, IN 46510
Estimated Value: $206,000 - $234,839
2
Beds
1
Bath
1,772
Sq Ft
$124/Sq Ft
Est. Value
About This Home
This home is located at 5124 E 1000 S, Claypool, IN 46510 and is currently estimated at $220,420, approximately $124 per square foot. 5124 E 1000 S is a home located in Kosciusko County with nearby schools including Whitko High School.
Ownership History
Date
Name
Owned For
Owner Type
Purchase Details
Closed on
Nov 30, 2017
Sold by
Montel Brent L and Level Sarah L
Bought by
Keim Rodney J and Keim Amy E
Current Estimated Value
Home Financials for this Owner
Home Financials are based on the most recent Mortgage that was taken out on this home.
Original Mortgage
$125,000
Outstanding Balance
$25,569
Interest Rate
3.94%
Mortgage Type
Commercial
Estimated Equity
$194,851
Purchase Details
Closed on
May 8, 2014
Sold by
Montel Brent L
Bought by
Montel Brent L and Montel Sarah L
Home Financials for this Owner
Home Financials are based on the most recent Mortgage that was taken out on this home.
Original Mortgage
$116,371
Interest Rate
4.28%
Mortgage Type
Future Advance Clause Open End Mortgage
Create a Home Valuation Report for This Property
The Home Valuation Report is an in-depth analysis detailing your home's value as well as a comparison with similar homes in the area
Purchase History
| Date | Buyer | Sale Price | Title Company |
|---|---|---|---|
| Keim Rodney J | -- | None Available | |
| Montel Brent L | -- | None Available |
Source: Public Records
Mortgage History
| Date | Status | Borrower | Loan Amount |
|---|---|---|---|
| Open | Keim Rodney J | $125,000 | |
| Previous Owner | Montel Brent L | $116,371 |
Source: Public Records
Tax History
| Year | Tax Paid | Tax Assessment Tax Assessment Total Assessment is a certain percentage of the fair market value that is determined by local assessors to be the total taxable value of land and additions on the property. | Land | Improvement |
|---|---|---|---|---|
| 2025 | $613 | $47,100 | $34,900 | $12,200 |
| 2024 | $661 | $50,000 | $37,500 | $12,500 |
| 2023 | $600 | $43,800 | $31,300 | $12,500 |
| 2022 | $533 | $42,400 | $24,700 | $17,700 |
| 2021 | $499 | $34,700 | $21,200 | $13,500 |
| 2020 | $511 | $33,200 | $21,100 | $12,100 |
| 2019 | $903 | $58,000 | $25,700 | $32,300 |
| 2018 | $1,225 | $75,700 | $43,800 | $31,900 |
| 2017 | $1,335 | $113,800 | $47,700 | $66,100 |
| 2016 | $1,565 | $158,200 | $49,400 | $108,800 |
| 2014 | $1,262 | $136,400 | $50,900 | $85,500 |
| 2013 | $1,262 | $131,700 | $46,200 | $85,500 |
Source: Public Records
Map
Nearby Homes
- 5105 E State Road 14
- E St Rd 14
- 7382 E 750 S
- 14415 Indiana 13
- 8880 W State Road 14
- 13522 Blickenstaff Rd Unit 24
- 5897 S 775 E
- 1407 E Orchard Dr
- 13309 N 100 E
- 1010 N Wayne St
- 207 N Line St
- 901 N Walnut St
- 21 Woodspoint Cir
- 111 N State St
- 1111 Marshall Way
- 600 N Sycamore St
- 1109 Marshall Way
- 101 S Maple St
- 1005 Garber Dr
- 307 E Sunset Dr
- 5164 E 1000 S
- 5259 E 1000 S
- 5402 E 1000 S
- 9722 S State Road 13
- 5389 E 1000 S
- 10266 S State Road 13
- 10251 S State Road 13
- 10251 Indiana 13
- 5303 E 1000 S
- 9719 S State Road 13
- 5453 E 1000 S
- 5453 E 1000 S
- 10315 S State Road 13
- 9616 S State Road 13
- 5455 E 1000 S
- 10347 S State Road 13
- 4639 E 1000 S
- 10435 S State Road 13
- 9543 S State Road 13
- 10479 S State Road 13
Your Personal Tour Guide
Ask me questions while you tour the home.