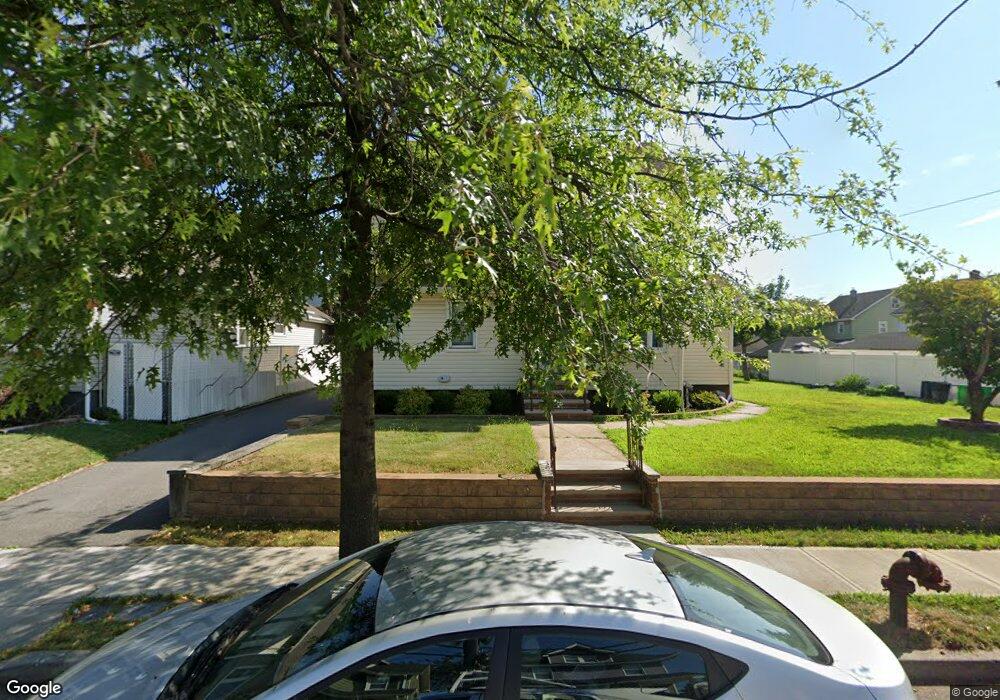
515 Harding Ave Unit 2 Lyndhurst, NJ 07071
Estimated Value: $720,000 - $775,000
2
Beds
1
Bath
1,652
Sq Ft
$451/Sq Ft
Est. Value
About This Home
This home is located at 515 Harding Ave Unit 2, Lyndhurst, NJ 07071 and is currently estimated at $745,146, approximately $451 per square foot. 515 Harding Ave Unit 2 is a home located in Bergen County with nearby schools including Lyndhurst High School and Sacred Heart School.
Ownership History
Date
Name
Owned For
Owner Type
Purchase Details
Closed on
Jun 13, 2019
Sold by
Klemens Anna and Klemens Dariusz
Bought by
Gaccione Melissa and Gaccione Michael
Current Estimated Value
Purchase Details
Closed on
Oct 26, 2011
Sold by
Kleff Sylvia C
Bought by
Klein Susan A
Home Financials for this Owner
Home Financials are based on the most recent Mortgage that was taken out on this home.
Original Mortgage
$254,400
Interest Rate
4.08%
Mortgage Type
Purchase Money Mortgage
Create a Home Valuation Report for This Property
The Home Valuation Report is an in-depth analysis detailing your home's value as well as a comparison with similar homes in the area
Home Values in the Area
Average Home Value in this Area
Purchase History
We collect this data history from publicly available records. To have your information removed, we recommend requesting removal directly through your county’s website.
| Date | Buyer | Sale Price | Title Company |
|---|---|---|---|
| Gaccione Melissa | $470,000 | -- | |
| Klein Susan A | $318,000 | -- |
Source: Public Records
Mortgage History
We collect this data history from publicly available records. To have your information removed, we recommend requesting removal directly through your county’s website.
| Date | Status | Borrower | Loan Amount |
|---|---|---|---|
| Previous Owner | Klein Susan A | $254,400 |
Source: Public Records
Tax History
| Year | Tax Paid | Tax Assessment Tax Assessment Total Assessment is a certain percentage of the fair market value that is determined by local assessors to be the total taxable value of land and additions on the property. | Land | Improvement |
|---|---|---|---|---|
| 2025 | $11,821 | $572,300 | $302,600 | $269,700 |
| 2024 | $11,302 | $566,700 | $300,100 | $266,600 |
| 2023 | $10,985 | $556,200 | $292,600 | $263,600 |
| 2022 | $10,985 | $346,300 | $198,400 | $147,900 |
| 2021 | $10,528 | $346,300 | $198,400 | $147,900 |
| 2020 | $10,299 | $346,300 | $198,400 | $147,900 |
| 2019 | $10,223 | $346,300 | $198,400 | $147,900 |
| 2018 | $10,306 | $346,300 | $198,400 | $147,900 |
| 2017 | $9,524 | $328,300 | $198,400 | $129,900 |
| 2016 | $9,311 | $328,300 | $198,400 | $129,900 |
| 2015 | $9,018 | $328,300 | $198,400 | $129,900 |
| 2014 | $8,900 | $328,300 | $198,400 | $129,900 |
Source: Public Records
Map
Nearby Homes
- 451 Wilson Ave
- 765 Chase Ave
- 752 Ridge Rd
- 1 4th St
- 554 Kingsland Ave
- 52 7th St
- 103 Lincoln Ave
- 115 Lincoln Ave
- 20 Bergen Ave
- 846 Riverside Ave Unit 202
- 724 3rd St
- 402 Riverview Ave
- 167 Bergen Ave
- 245 Wilson Ave
- 825 Riverside Ave Unit 203
- 23 Veterans Place
- 715 Stuyvesant Ave
- 25 Veterans Place
- 501 Chase Ave
- 712 Meyer Ave
- 474 Wilson Ave
- 492 Wilson Ave
- 501 Harding Ave
- 495 Harding Ave
- 466 Wilson Ave
- 466 Wilson Ave Unit 1
- 466 Wilson Ave Unit 2
- 505 Harding Ave
- 491 Harding Ave
- 494 Wilson Ave
- 464 Wilson Ave
- 507 Harding Ave
- 487 Harding Ave
- 483 Wilson Ave
- 471 Wilson Ave
- 496 Wilson Ave
- 487 Wilson Ave
- 462 Wilson Ave
- 483 Harding Ave
- 515 Harding Ave
Your Personal Tour Guide
Ask me questions while you tour the home.