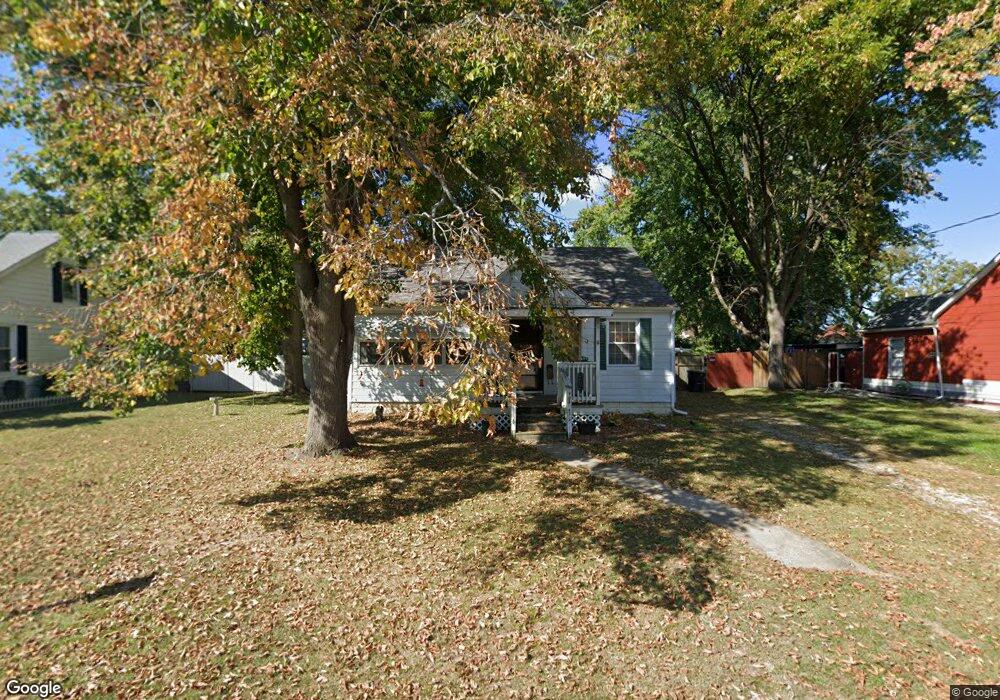
515 S 19th St Belleville, IL 62226
Estimated Value: $76,000 - $127,000
Studio
--
Bath
906
Sq Ft
$115/Sq Ft
Est. Value
About This Home
This home is located at 515 S 19th St, Belleville, IL 62226 and is currently estimated at $103,797, approximately $114 per square foot. 515 S 19th St is a home located in St. Clair County with nearby schools including Union Elementary School, West Jr High School, and Governor French Academy.
Ownership History
Date
Name
Owned For
Owner Type
Purchase Details
Closed on
Jun 6, 2009
Sold by
Mehrtens Jeffrey S and Mehrtens Nicole A
Bought by
Mehrtens Nicole A
Current Estimated Value
Purchase Details
Closed on
Sep 17, 2004
Sold by
Mehrtens Jeffrey S
Bought by
Mehrtens Jeffrey S and Mehrtens Nicole A
Home Financials for this Owner
Home Financials are based on the most recent Mortgage that was taken out on this home.
Original Mortgage
$56,000
Interest Rate
5.95%
Mortgage Type
Stand Alone Refi Refinance Of Original Loan
Purchase Details
Closed on
Aug 1, 1995
Bought by
Mehrtens Nicole A
Create a Home Valuation Report for This Property
The Home Valuation Report is an in-depth analysis detailing your home's value as well as a comparison with similar homes in the area
Home Values in the Area
Average Home Value in this Area
Purchase History
| Date | Buyer | Sale Price | Title Company |
|---|---|---|---|
| Mehrtens Nicole A | -- | None Available | |
| Mehrtens Jeffrey S | -- | Metro East Title Corporation | |
| Mehrtens Nicole A | $40,500 | -- |
Source: Public Records
Mortgage History
| Date | Status | Borrower | Loan Amount |
|---|---|---|---|
| Closed | Mehrtens Jeffrey S | $56,000 |
Source: Public Records
Tax History
| Year | Tax Paid | Tax Assessment Tax Assessment Total Assessment is a certain percentage of the fair market value that is determined by local assessors to be the total taxable value of land and additions on the property. | Land | Improvement |
|---|---|---|---|---|
| 2024 | $2,136 | $30,289 | $4,940 | $25,349 |
| 2023 | $2,075 | $28,109 | $4,842 | $23,267 |
| 2022 | $1,848 | $25,305 | $4,359 | $20,946 |
| 2021 | $1,734 | $23,394 | $4,030 | $19,364 |
| 2020 | $1,660 | $22,122 | $3,811 | $18,311 |
| 2019 | $1,727 | $22,670 | $3,817 | $18,853 |
| 2018 | $1,675 | $22,179 | $3,734 | $18,445 |
| 2017 | $1,663 | $22,023 | $3,708 | $18,315 |
| 2016 | $1,637 | $21,555 | $3,629 | $17,926 |
| 2014 | $1,188 | $18,850 | $3,459 | $15,391 |
| 2013 | $1,598 | $19,119 | $3,508 | $15,611 |
Source: Public Records
Map
Nearby Homes
Your Personal Tour Guide
Ask me questions while you tour the home.