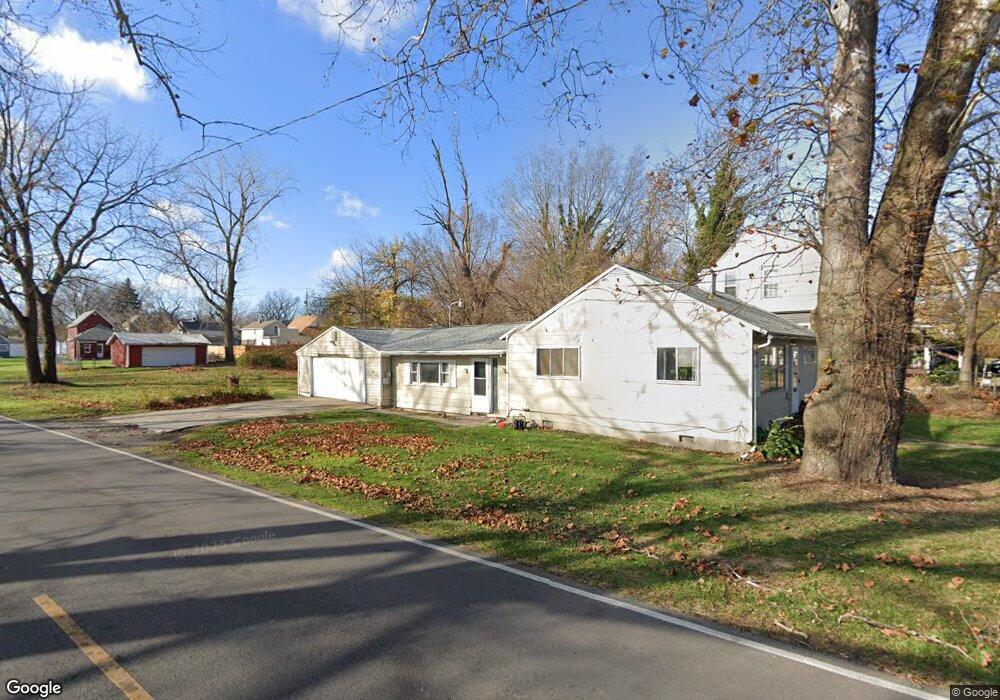
518 Nye St Lima, OH 45801
Riverside North NeighborhoodEstimated Value: $62,885 - $142,000
3
Beds
1
Bath
1,296
Sq Ft
$72/Sq Ft
Est. Value
About This Home
This home is located at 518 Nye St, Lima, OH 45801 and is currently estimated at $92,971, approximately $71 per square foot. 518 Nye St is a home located in Allen County with nearby schools including Heritage Elementary School, Lima North Middle School, and Lima West Middle School.
Ownership History
Date
Name
Owned For
Owner Type
Purchase Details
Closed on
Apr 18, 2019
Sold by
Blass Holding Llc
Bought by
Blue Chip Housing Llc
Current Estimated Value
Home Financials for this Owner
Home Financials are based on the most recent Mortgage that was taken out on this home.
Original Mortgage
$487,267
Outstanding Balance
$374,530
Interest Rate
4.4%
Mortgage Type
Commercial
Estimated Equity
-$281,559
Purchase Details
Closed on
Apr 11, 2018
Sold by
Fisher Investment Porperty Inc
Bought by
Blass Holding Llc
Home Financials for this Owner
Home Financials are based on the most recent Mortgage that was taken out on this home.
Original Mortgage
$257,437
Interest Rate
4.43%
Mortgage Type
Commercial
Purchase Details
Closed on
Jan 1, 1990
Bought by
Smith Wallace H
Create a Home Valuation Report for This Property
The Home Valuation Report is an in-depth analysis detailing your home's value as well as a comparison with similar homes in the area
Home Values in the Area
Average Home Value in this Area
Purchase History
We collect this data history from publicly available records. To have your information removed, we recommend requesting removal directly through your county’s website.
| Date | Buyer | Sale Price | Title Company |
|---|---|---|---|
| Blue Chip Housing Llc | $475,000 | None Available | |
| Blass Holding Llc | $343,300 | None Available | |
| Smith Wallace H | -- | -- |
Source: Public Records
Mortgage History
We collect this data history from publicly available records. To have your information removed, we recommend requesting removal directly through your county’s website.
| Date | Status | Borrower | Loan Amount |
|---|---|---|---|
| Open | Blue Chip Housing Llc | $487,267 | |
| Previous Owner | Blass Holding Llc | $257,437 |
Source: Public Records
Tax History
| Year | Tax Paid | Tax Assessment Tax Assessment Total Assessment is a certain percentage of the fair market value that is determined by local assessors to be the total taxable value of land and additions on the property. | Land | Improvement |
|---|---|---|---|---|
| 2024 | $554 | $13,900 | $4,240 | $9,660 |
| 2023 | $597 | $13,240 | $4,030 | $9,210 |
| 2022 | $701 | $13,240 | $4,030 | $9,210 |
| 2021 | $685 | $13,240 | $4,030 | $9,210 |
| 2020 | $716 | $13,450 | $2,350 | $11,100 |
| 2019 | $716 | $13,450 | $2,350 | $11,100 |
| 2018 | $714 | $13,450 | $2,350 | $11,100 |
| 2017 | $719 | $13,450 | $2,350 | $11,100 |
| 2016 | $729 | $13,450 | $2,350 | $11,100 |
| 2015 | $787 | $13,450 | $2,350 | $11,100 |
| 2014 | $787 | $14,420 | $2,380 | $12,040 |
| 2013 | $767 | $14,420 | $2,380 | $12,040 |
Source: Public Records
Map
Nearby Homes
- 846 Faurot Ave
- 852 Faurot Ave
- 325 Nye St
- 932 Faurot Ave
- 411 S Collett St
- 514 N Shore Dr
- 705 W Elm St
- 30 Property Portfolio
- 343 S Charles St
- 431 S Jameson Ave
- 712 S Elizabeth St
- 1534 Lakewood Ave
- 325 N McDonel St
- 854 W Wayne St
- 233 S Kenilworth Ave
- 1211 W Elm St
- 431 N Metcalf St
- 1619 Lakewood Ave
- 508 N Collett St
- 1023 Brice Ave
Your Personal Tour Guide
Ask me questions while you tour the home.