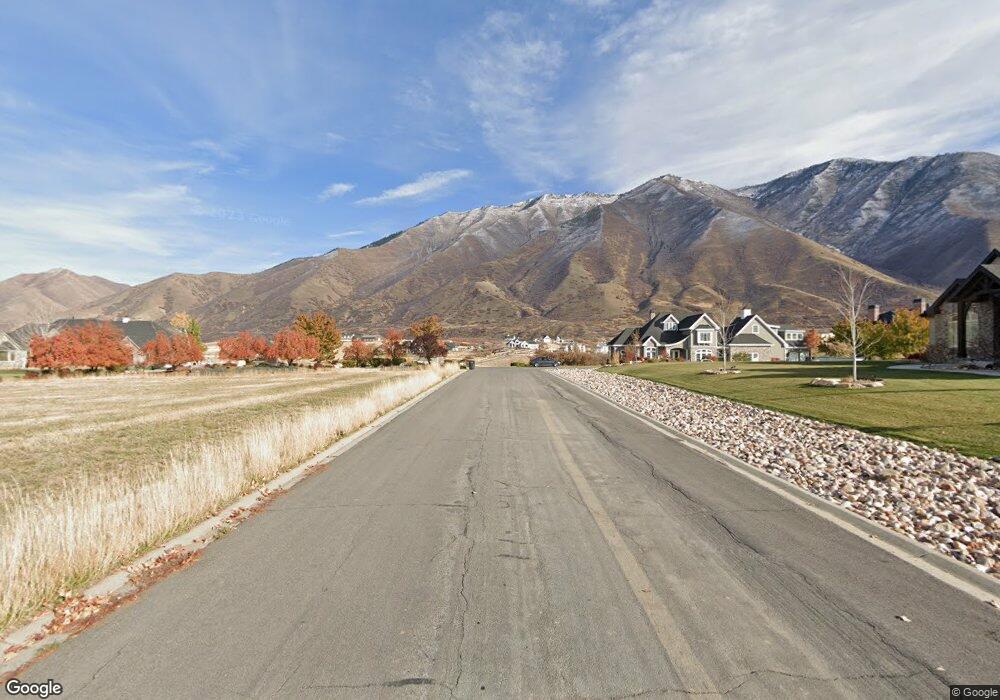
518 W 2925 S Mapleton, UT 84664
Estimated Value: $1,392,000 - $1,705,692
3
Beds
4
Baths
2,661
Sq Ft
$582/Sq Ft
Est. Value
About This Home
This home is located at 518 W 2925 S, Mapleton, UT 84664 and is currently estimated at $1,548,846, approximately $582 per square foot. 518 W 2925 S is a home located in Utah County with nearby schools including Maple Ridge Elementary, Mapleton Junior High School, and Maple Mountain High School.
Ownership History
Date
Name
Owned For
Owner Type
Purchase Details
Closed on
Apr 22, 2008
Sold by
Allan Dean S and Allan Jean A
Bought by
Allan John L and Allan Anne
Current Estimated Value
Purchase Details
Closed on
Mar 7, 2001
Sold by
Allan John and Allan Anne
Bought by
Allan John Leslie and Allan Anne
Purchase Details
Closed on
May 22, 2000
Sold by
Strong Jeanne A and Strong Douglas J
Bought by
Allan Dean S and Allan David W
Purchase Details
Closed on
May 20, 1999
Sold by
Allan John Leslie
Bought by
Allan John Leslie and Allan Anne
Home Financials for this Owner
Home Financials are based on the most recent Mortgage that was taken out on this home.
Original Mortgage
$223,272
Interest Rate
7.01%
Purchase Details
Closed on
Dec 1, 1998
Sold by
Allan Dean S and Allan Jean A
Bought by
Allan John Leslie
Create a Home Valuation Report for This Property
The Home Valuation Report is an in-depth analysis detailing your home's value as well as a comparison with similar homes in the area
Home Values in the Area
Average Home Value in this Area
Purchase History
| Date | Buyer | Sale Price | Title Company |
|---|---|---|---|
| Allan John L | -- | None Available | |
| Allan John Leslie | -- | Pro Title & Escrow Inc | |
| Allan Dean S | -- | -- | |
| Allan Dean S | -- | -- | |
| Allan John Leslie | -- | Provo Land Title Company | |
| Allan John Leslie | -- | -- |
Source: Public Records
Mortgage History
| Date | Status | Borrower | Loan Amount |
|---|---|---|---|
| Previous Owner | Allan John Leslie | $223,272 |
Source: Public Records
Tax History
| Year | Tax Paid | Tax Assessment Tax Assessment Total Assessment is a certain percentage of the fair market value that is determined by local assessors to be the total taxable value of land and additions on the property. | Land | Improvement |
|---|---|---|---|---|
| 2025 | $10,356 | $1,127,785 | -- | -- |
| 2024 | $10,356 | $1,014,525 | $0 | $0 |
| 2023 | $10,270 | $1,012,455 | $0 | $0 |
| 2022 | $11,337 | $1,714,200 | $899,900 | $814,300 |
| 2021 | $9,942 | $1,251,900 | $625,500 | $626,400 |
| 2020 | $9,487 | $1,168,100 | $565,800 | $602,300 |
| 2019 | $8,956 | $1,118,100 | $515,800 | $602,300 |
| 2018 | $8,530 | $1,033,100 | $468,800 | $564,300 |
| 2017 | $8,151 | $608,465 | $0 | $0 |
| 2016 | $7,312 | $542,595 | $0 | $0 |
| 2015 | $6,913 | $509,870 | $0 | $0 |
| 2014 | $5,684 | $411,730 | $0 | $0 |
Source: Public Records
Map
Nearby Homes
- 872 W Union Bench Dr
- 684 W Lookout Point Dr
- 1060 W 2620 S
- 3167 S Mapleton Estates Dr
- 831 W Rock Ridge Dr
- 53 E Twin Hollow Dr Unit 10
- 525 N 1550 W Unit COLUMB
- 525 N 1550 W Unit WINDSO
- 525 N 1550 W Unit HILDAL
- 525 N 1550 W Unit BALLAR
- 525 N 1550 W Unit CALDWE
- 525 N 1550 W Unit DREXEL
- 525 N 1550 W Unit MORGAN
- 525 N 1550 W Unit WAKEFI
- 525 N 1550 W Unit ARDEN
- 3958 S Sage Wood Ave Unit CHAMBE
- 3247 S Mapleton Estates Dr
- 3482 S Sugar Maple Ct
- 3067 S Hidden Ridge Ln
- 3117 S Hidden Ridge Ln
- 2796 S Hidden Canyon Dr
- 648 W Overlook Ridge Cir Unit 4
- 648 W Overlook Ridge Cir
- 3011 S 450 W
- 683 Overlook Ridge Cir
- 602 W 2925 S
- 602 W 2925 S Unit 3
- 2698 S Hidden Canyon Dr
- 2698 S Hidden Canyon Dr Unit Downstairs
- 662 W Overlook Ridge Cir
- 2648 S Hidden Canyon Dr Unit 15
- 2648 S Hidden Canyon Dr
- 662 W Overlook Ridge
- 662 W Overlook Ridge Cir
- 3031 S 450 W
- 3031 S 450 W Unit 1
- 2344 S Hidden Canyon Dr Unit 14
- 2608 S Hidden Canyon Dr Unit 14
- 599 W 2925 S
- 2697 S Hidden Canyon Dr Unit 17
Your Personal Tour Guide
Ask me questions while you tour the home.